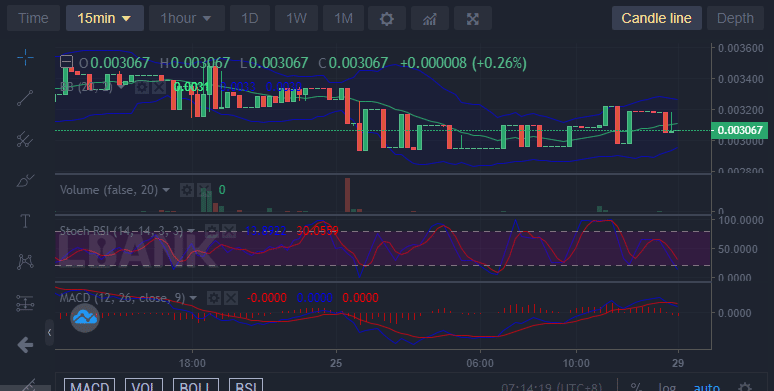
At the price level of $0.003100, the bears and bulls seem to be seriously struggling to control the market. Battle Infinity is now in a consolidating market trend and this has been happening since the 24th of September. After this market indecision period, a decisive market direction will be made. Presently, the price of the market remains at $0.003067
Key Levels
Resistance: $0.003600, $0.003650, $0.003700
Support: $0.003000, $0.002500, $0.002000
IBAT/USD: The Indicators’ Outlook
The Relative Strength Index still points to a bullish market as the RSI line measures market strength at 70%. But the MACD indicator appears to be lagging as the two lines are still in the negative zone. They are below level zero (the midpoint between the bearish and bullish market. The MACD line has crossed the signal line in the signal line and the negative histograms are reducing very fast. From the interpretation of information that we get from MACD, we see a market recovering from the uptrend.

Battle Infinity Short-Term Outlook: Bullish Recovery (15-minute chart)
In contrast to the interpretation that we get from the 1-hour chart, the indicators are pointing to the fact that the market is changing direction in favour of bears. The RSI line and the MACD line are now pointing down. They are going down. This explains why the trend on the 1-hour chart is stagnant. If this continues, the trend may reverse.
Want a coin that has a huge potential for massive returns? That coin is Battle Infinity.
Buy IBAT now.


Leave a Reply