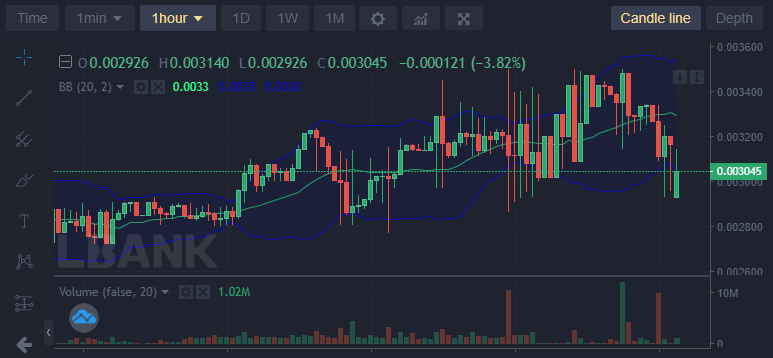
As the market continues on the uptrend, it experiences some price retracement along the line. Replacements are just brief price pullback and it occurs as traders take profits along a particular uptrend. They are not price reversals that stand for a total change in price direction. Battle Infinity was rejected twice at the resistance level of $0.003484 before it takes its support at $0.002934. The price should launch for greater height from this point.
Key Levels
Resistance: $0.003600, $0.003650, $0.003700
Support: $0.003000, $0.002500, $0.002000
IBAT/USD: The Indicators’ Outlook
From the Bollinger band indicator, we see the price action going below the lower band of the indicator. This clearly shows the market entering into the oversold territory. The price action is expected to correct itself back into the bands.
The Relative Strength Index also confirms this sentiment. The two lines of the RSI in this timeframe swing erratically between the high and low at proximity. Currently, both lines are in the oversold zone. The market is expected to soon continue the uptrend. Traders are to wait for confirmation from the RSI before placing trades. At any moment now, the fast line will cross the slow line, and then they can enter their long position.

Battle Infinity Short-Term Outlook: Bullish Recovery (15-minute chart)
This timeframe allowed us to see the tug-of-war between the forces of buyers and sellers. Selling pressure seems proportional to buying pressure. But there is a slight difference that set bulls apart from bears. There is more buying in the market than selling. And also with the price action overlapping the lower band of the indicator, we can be sure that the uptrend will resume soon.
Want a coin that has a huge potential for massive returns? That coin is Battle Infinity.
Buy IBAT now.


Leave a Reply