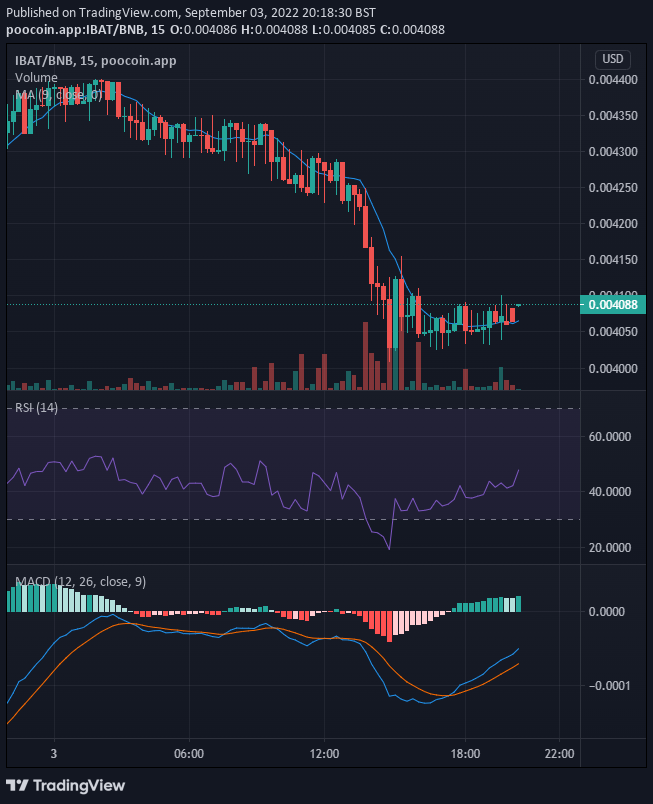
The price of Battle Infinity (IBAT/USD) is rising in confirmation of the previous prediction that the price will rise, Buyers are regaining their ground in the market and they are pushing the price to an upper price level. Although the selling pressure is still strong, buyers are gaining more momentum and they will soon take the market. This price recovery may not be obvious on the chart by just viewing candlestick patterns, but with the help of indicators, we can look through the chart to see the market well.
Key Levels
Resistance: $0.004166, $0.004235, $0.004283
Support: $0.004027, $0.003974, $0.0039220
IBAT/USD: The Indicators’ Outlook
After the RSI line recovered from the oversold zone in the 14th hour of today’s trading session, the line has been on an upward retracement. Although for now, the price is still at 35%, there is a high probability that the price will recover to the upside. In confirmation of this information, the MACD histogram shows that the bearish momentum is weakening. This is evident by the small pink-coloured histograms on the chart.

Battle Infinity Short-Term Trend: Bullish (15-minute chart)
In this short timeframe, we can see that the bullish recovery is more evident. The negative histograms have become positive. The faster line has crossed the slower line. And the RSI line at 48% is getting close to the 50% demarcation between the RSI indication for a strong market and a weak market. The momentum is on the rise.
Want a coin that has a huge potential for massive returns? That coin is Battle Infinity.
Buy IBAT now.


Leave a Reply