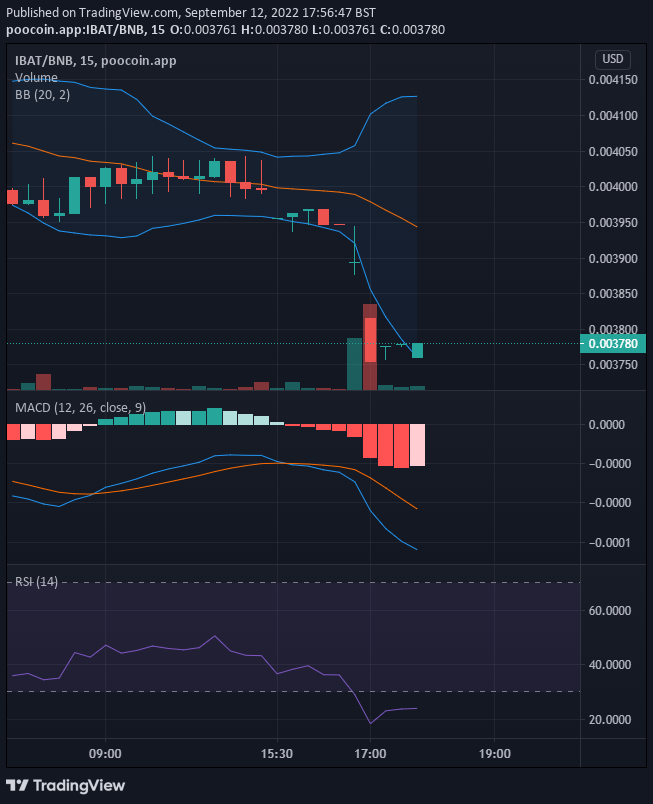
In the 17th hour of today’s trading session, we see the bearish candlestick shooting below the lower band of the Bollinger Band. This candlestick behaviour is very significant as it means an imminent upward price retracement. Sellers are selling the crypto below its intrinsic value. This will usually result in price correcting into the upper level. With this chart information IBAT/USD, we can expect an upward price rebound.
Key Levels
Resistance: $0.003900, $0.004000, $0.004100
Support: $0.003600, $0.003500, $0.003400
IBAT/USD: The Indicators’ Outlook
In the MACD, the signal line and the MACD line have crossed to the negative side along with the histograms. By this time, the price has gone well into the oversold territory. The Relative Strength Index shows how the price has dropped below the downside at 27%. Investors should place a buy trade at this point for a profitable return.

IBAT/USD Short-Term Outlook: Bullish Recovery (15-minute chart)
In IBAT/USD Moving Average Convergence and Divergence indicator, we can see that the bearish momentums are beginning to reduce; paving way for the bullish price recovery. On the negative side of the indicator, we can see that the last histogram is slowing down. Soon the MACD will follow this trend. Investors should be prepared to place their buy trade at the right time. That is when the Indicator of the bigger timeframe confirms the uptrend.
Want a coin that has a huge potential for massive returns? That coin is Battle Infinity.
Buy IBAT now.


Leave a Reply