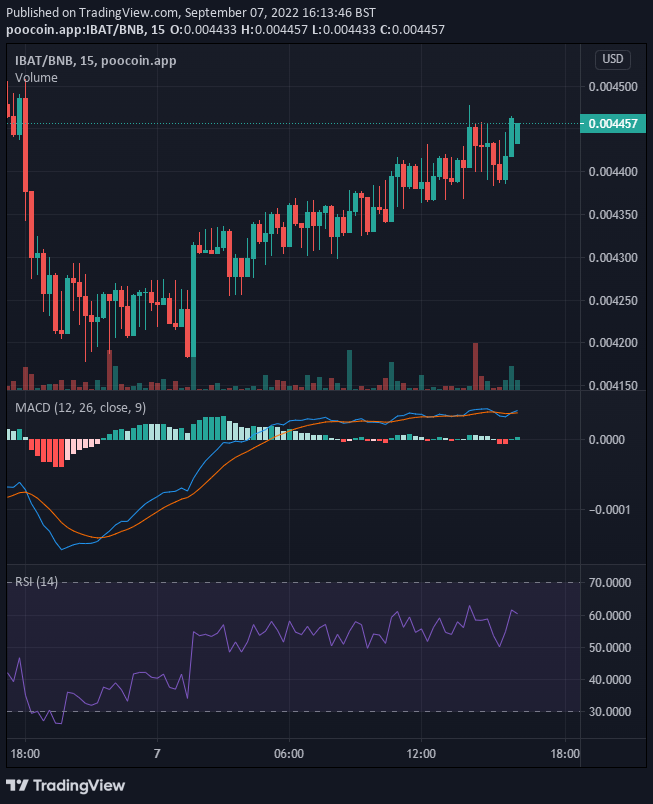
In yesterday’s market activities, we identify an opportunity for investors to enter the Battle Infinity trade for a profitable return. And so far we can see how the market is progressing steadily to the upside. As the bulls keep pushing the price to the upside, the strong selling pressure can yet be felt as they slow down the bullish momentum. Despite this, buyers prove stronger than the seller and they steadily push the price to $0.004459. Looking at the chart, there is an expectation that Battle Infinity will continue to rise.
Key Levels
Resistance: $0.004500, $0.004600, $0.004700
Support: $0.004300, $0.004200 $0.004100
IBAT/USD: The Indicators’ Outlook
The trading session opened today with buyers having the upper hand over sellers even though sellers were also aggressive. The progressive green histograms in today’s Moving Average Convergence and Divergence indicator testify to the bullish victory. The two MACD lines crossed each other in the third hour of the day to confirm the new trend and that trend has continued till the moment of writing this analysis. The Relative Strength Index is slow to register the price recovery from the downside. But presently, the market strength is measured at 54.83%.

Battle Infinity Short-Term Trend: Bullish (15-minute chart)
As we scale into this timeframe, we began to gain a clearer view of the struggle between the buyers and sellers. The market action here is almost going on a horizontal line. The MACD histograms are frequently swinging between the positive side and the negative side of the indicator. And the two MACD lines are almost going on a horizontal line. The bullish victory can be seen in the indicator as there are more green histograms than red ones. And both the lines and the price actions are ascending in order to confirm the uptrend.
Want a coin that has a huge potential for massive returns? That coin is Battle Infinity.
Buy IBAT now.


Leave a Reply