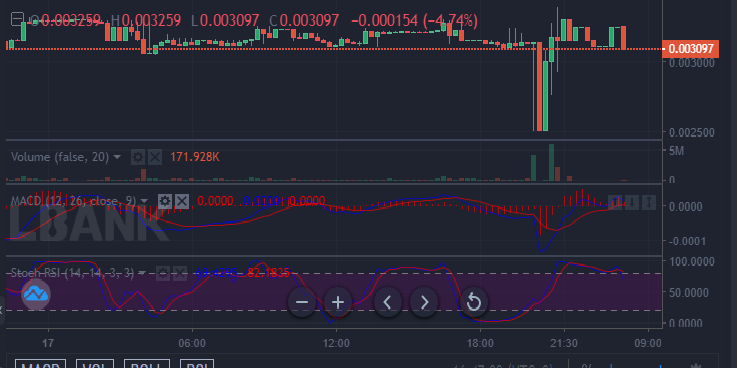
After the price reaches the support level of $0.003133, the market changes bearing to the upside. By now it is expected that the price should have broken the $0.003500 resistance level, but strong pressure from the bears kept the price ranging near the $0.0034500 resistance level. The price of IBAT/USD is currently at $0.003436. The bulls are still relentless.
Key Levels
Resistance: $0.003600, $0.003700, $0.003800
Support: $0.003400, $0.003300, $0.003200
IBAT/USD: The Indicators’ Outlook
The bullish momentum that started yesterday continued till the 11th hour of today. But during the bullish market, we see that bulls are not stable. They appear to be weakening. By the 17th hour of the day, the price switched to a downtrend in the MACD as the positive histograms begin to change to negative histograms. The same thing was reflected in the RSI. The RSI line fell to 37.8% from 62%. Now, the price is recovering. This is evident in the MACD and the RSI. The last two histograms of the MACD show that selling pressure is weakening.

IBAT/USD Short-Term Outlook: Bullish Recovery (15-minute chart)
True to the bullish recovery that we see on the last two sessions of the one-hour chart, here are impressive bullish performances. Buyers are coming back to take ground in the market again. And soon enough, this will also reflect on the 1-hour chart. Following the 1 hour chart, this trading outlook is initially in the downtrend, but now, it is recovering.
Want a coin that has a huge potential for massive returns? That coin is Battle Infinity.
Buy IBAT now.


Leave a Reply