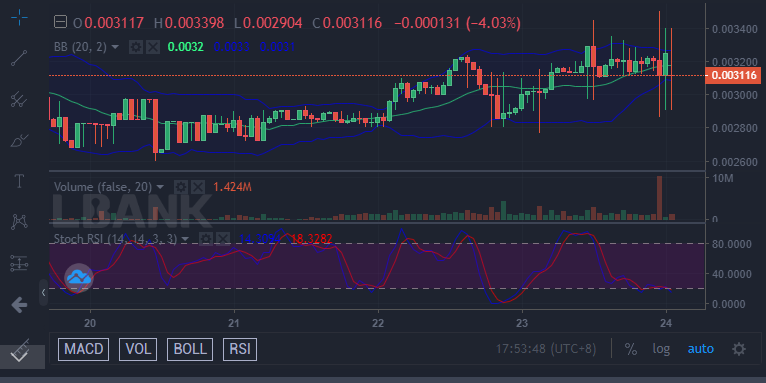
It is a very rough and intense fight between Battle Infinity buyers and sellers today. And the buyers are having the upper hand as they push through the bearish resistance steadily. The slow progress may be due to the strong opposition from the sellers. The recent candlestick patterns on the chart are having long shadows above and below them. This is a sign of high volatility in the market. But, despite this, the market is pushing through.
Key Levels
Resistance: $0.003200, $0.003286, $0.003376
Support: $0.002500, $0.002231, $0.002000
IBAT/USD: The Indicators’ Outlook
The Relative Strength Index has had several swings lately. Presently the lines had fallen to the edge of the oversold territory. The tug-of-war between the two market forces seems to fix the price At this point. The current price is $0.003155 and the price action has tested the height of the $0.003400 resistance level.
The Bollinger band indicator shows that due to this intense struggle, the market is entering into a consolidation period. The upper band and the lower band are compressing against the market activities. After the ranging market, there is going to be a decisive directional move. Battle Infinity is going to rise to an upper price level after the consolidation period.

Battle Infinity Short-Term Outlook: Bullish Recovery (15-minute chart)
In the 15-minute timeframe, the RSI line has gone into oversold. The signal line is not far from the RSI line. At this point, we should expect the price of the market to begin to rise as traders begin to buy again. We can be sure that the price will rise because, the Bollinger band indicates that there is about to be a breakout and the RSI shows that the market is in the oversold region; when the price enters the oversold zone, it is expected that the price will rise again.
Want a coin that has a huge potential for massive returns? That coin is Battle Infinity.
Buy IBAT now.


Leave a Reply