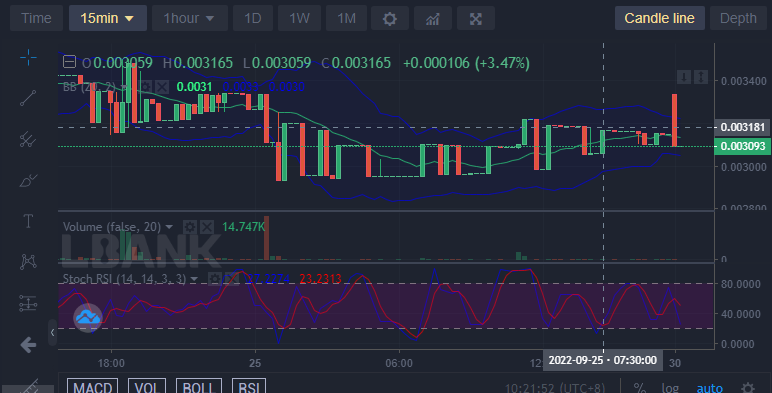
The price of Battle Infinity made a slight advancement to a higher price when we compare today’s price with that of yesterday. In the very recent one-hour trading session, a very powerful bullish pressure made the price touch the $0.003400 resistance level. The sellers became very strong and completely dominated the session. And the price now settles at $0.003089 as the current price; this is the mid-range in the Bollinger band indicator.
Key Levels
Resistance: $0.003600, $0.003650, $0.003700
Support: $0.003000, $0.002500, $0.002000
IBAT/USD: The Indicators’ Outlook
In the Bollinger band indicator, the price action remains at the midpoint of the band. Even though the market is very volatile, the price keeps settling at the midrange of the indicator. At the present, the upper and lower band of the indicator are converging. This will precede the expected bullish trend in the IBAT/USD market. The Relative Strength Index portrays how very active and rapid the market oscillates from the upper level to the lower level of the indicator.

Battle Infinity Short-Term Outlook: Bullish Recovery (15-minute chart)
Presently, the RSI line is now in the oversold area, we are expecting the trend to switch to an uptrend soon. However, the price seems static at the current price of $0.003089. In the Moving Average Convergence and Divergence, the fast line crosses the slow line to signal a switch to the trend that favours the bears but right now the fast is trying to correct back to an upper level.
Want a coin that has a huge potential for massive returns? That coin is Battle Infinity.
Buy IBAT now.


Leave a Reply