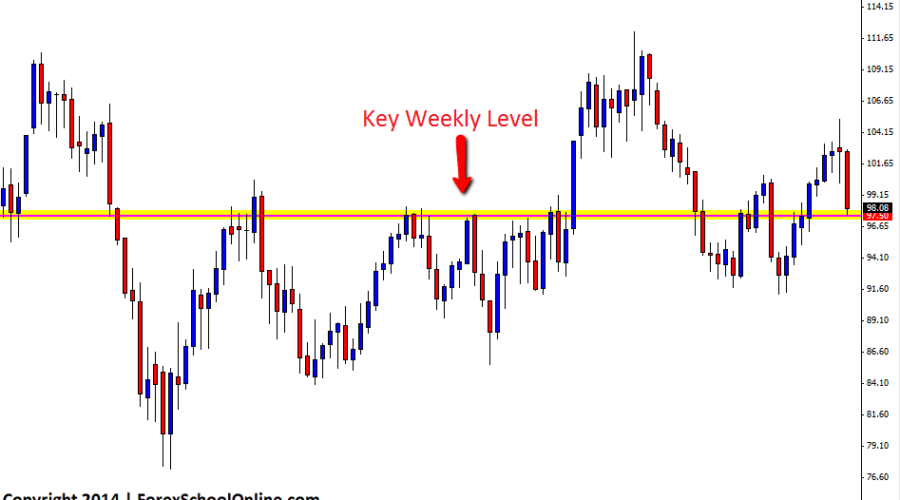
Price on the Oil (OILvUSD) daily price action chart has slammed lower into the 50% Fibonacci level after making a large run higher in recent times. After making a sustained run higher, price made a bearish 2 bar reversal that was rejecting resistance and once price started a move lower the move has …
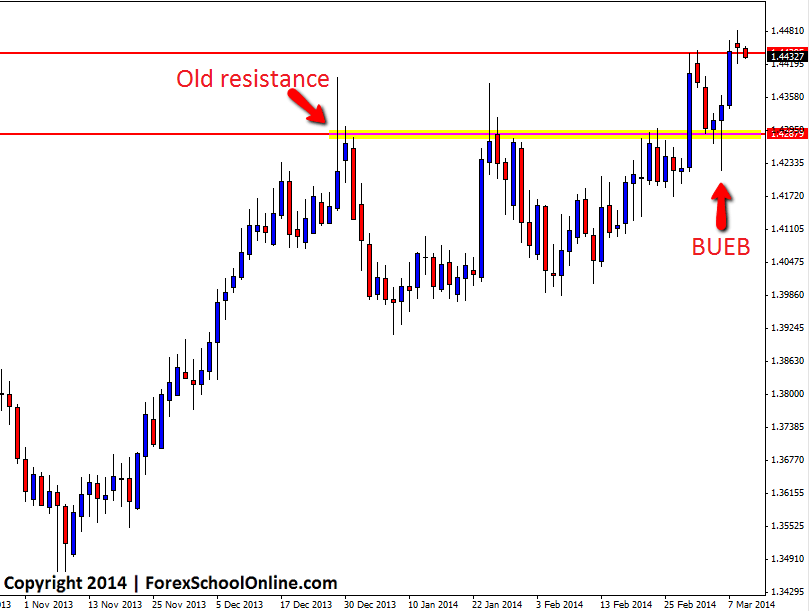
Engulfing Bars Send Price Higher From Price Flip Area | 11th Mar 2014
For price action traders the emphasis for all high probability trades is looking for the best areas to play their trades from and building a strong price action story to back up their trade. For example; is the trade with the trend? Is the trade moving off a price flip area? Does price have space to …
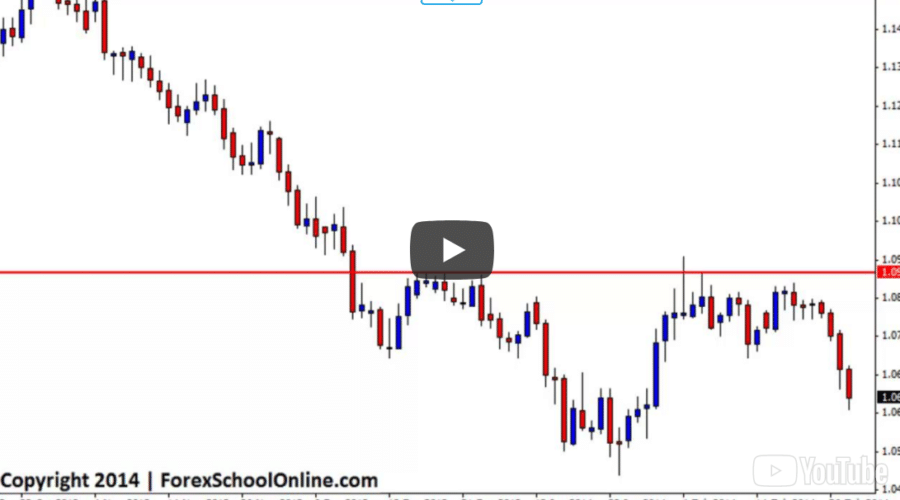
False Break Pin Bar Setup on Daily Chart
One of the most powerful trading signals that price action traders can trade with is the false break pin bar reversal. When traded correctly and from the correct areas in the market, the false break pin bar can be a very high probability trading setup especially when traded on the higher time frames …


