Price on the daily chart of the EURNOK chart has formed back-to-back Inside Bars = IB's sitting right on-top of a major support level that was also a key price flip for this market. These Double Inside Bars have acted as price clues and footprints for price to make a breakout attempt that is in …
How to Find and Trade the False Breakout in Your Forex Trading
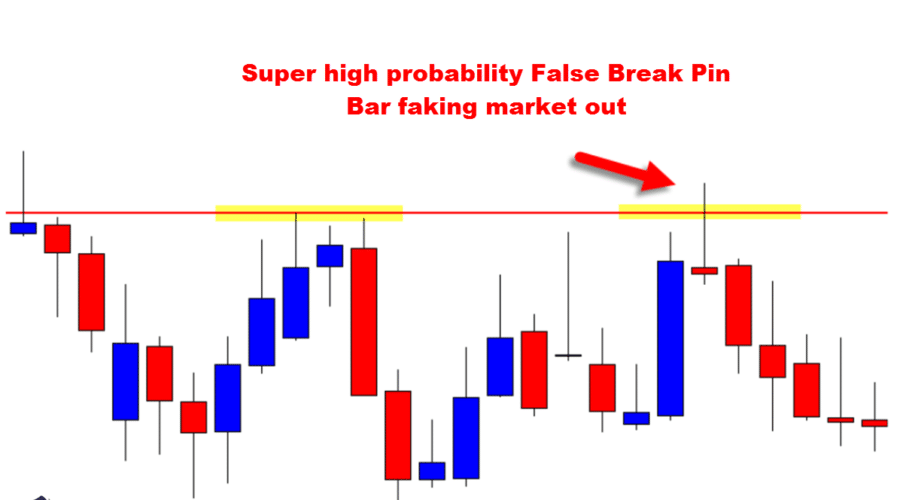
How to Find and Trade the False Breakout in Your Forex Trading Do you often get faked out of the market or enter a trade just to watch it quickly turn into a false breakout? Sometimes that is unavoidable, but often there is a price action clue and a footprint of where price is about to make it’s …
Where Will AUDCAD 4 Hour Chart Inside Bars Go? | 8th Feb 2017
The Daily price action chart of the AUDCAD is a heaven of trigger signals of late, forming rejection price action setups rejecting the major price flip level. As my first chart below highlights for you; price has rejected this level and also formed solid price action triggers such as Bearish …


