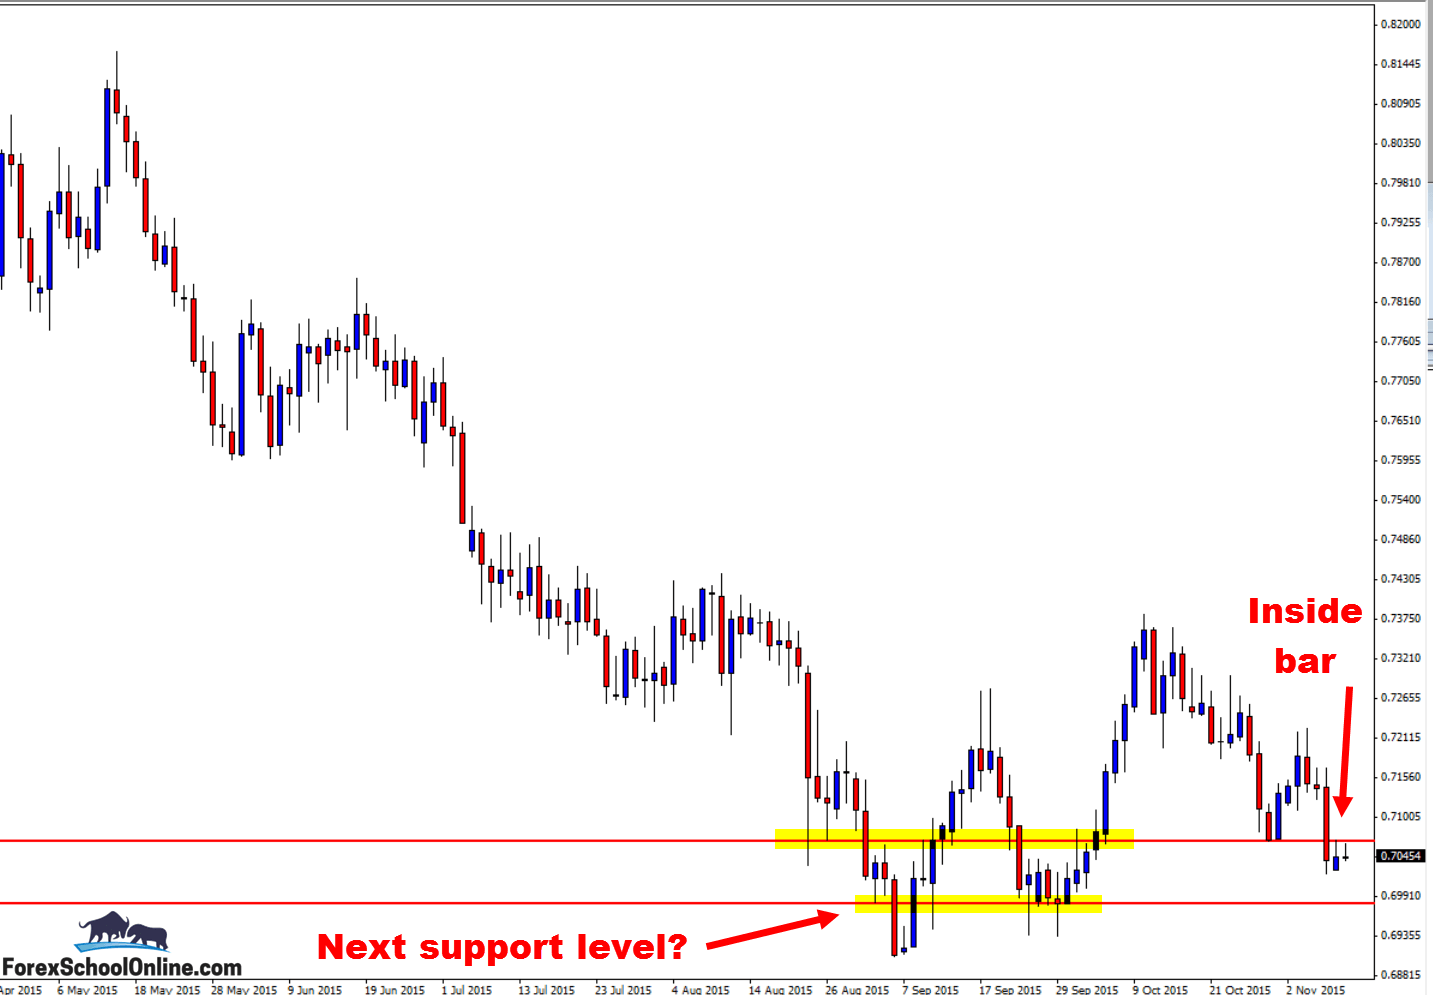
The AUDUSD or the Aussie, as it is often known around the world by many, has fired off an inside bar price action trade setup on the daily chart. This inside bar is sitting just below and rejecting a major daily resistance level, which at this stage is proving crucial to the overall price action situation.
In the last couple of weeks, there has been no clear trend with price ranging and moving sideways. As the daily chart shows below with the clearly marked levels, even though price has been in this range and in a sideways movement over the last few weeks, there are still some major levels to hunt trades from.
That’s the awesome thing about price action. When you understand how to trade price action correctly and have a good Forex education about the different market types, you are able to trade in all market types and in all directions.
This inside bar on the AUDUSD is quite a powerful little candlestick that is giving us quite a lot of information for such a small candle. This is not often the case for small candles, but in this situation, it is not the size of the candle, but WHERE the candle has formed.
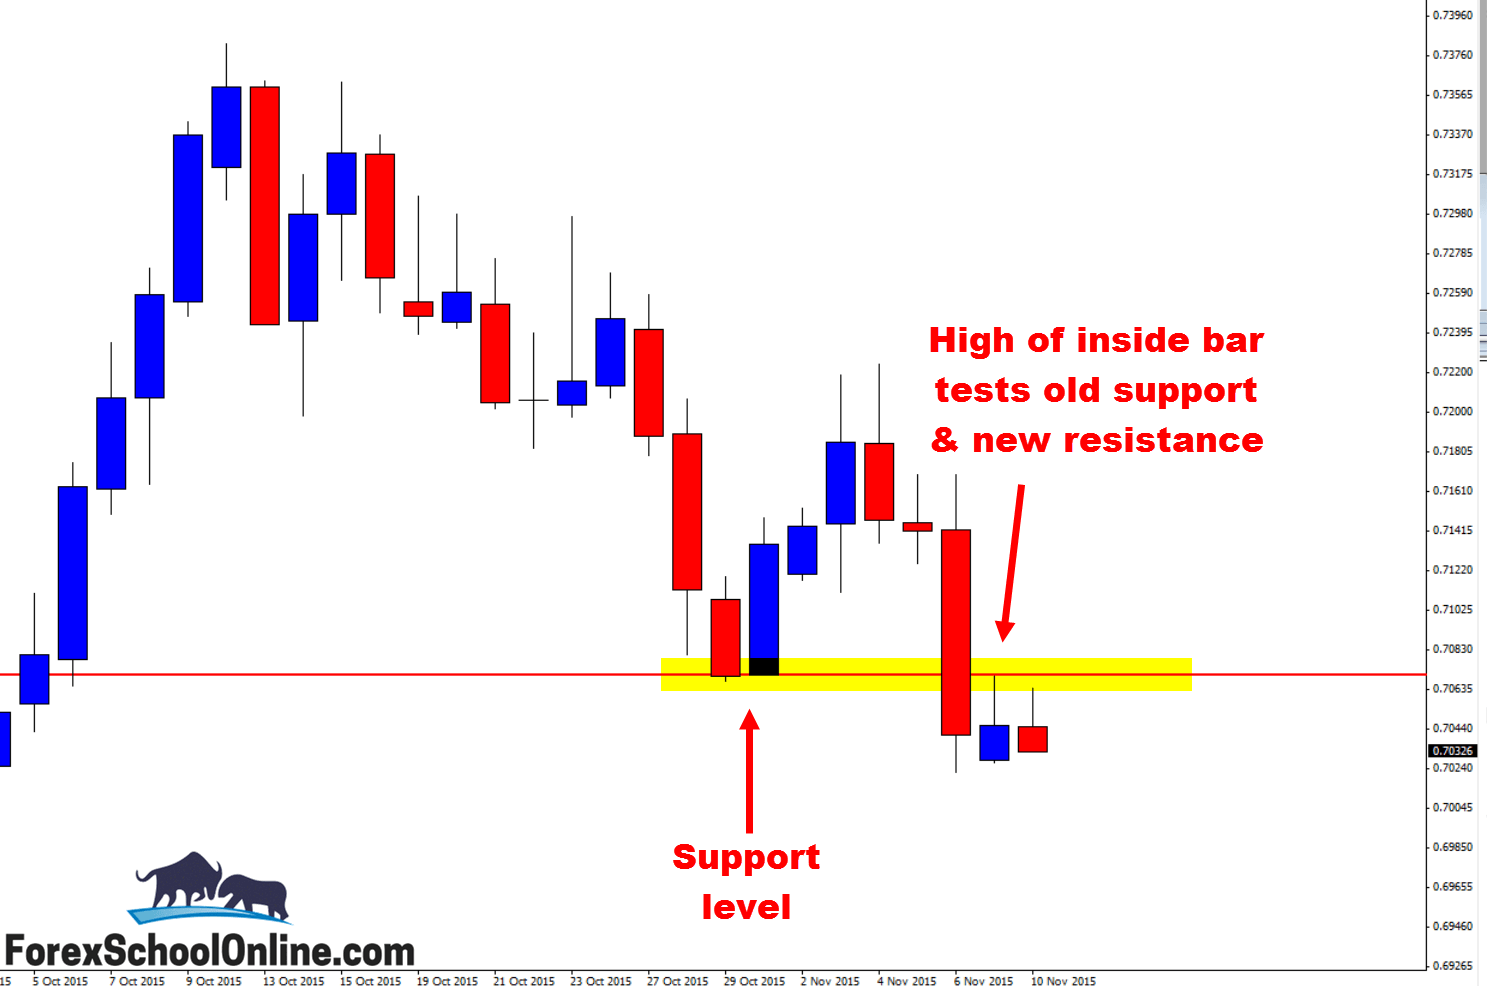
In fact, because the candle is so small, it actually tells us something as well. As you can see from the chart below, price was able to break below the support level, but what was most important was that price managed to CLOSE below the support level, meaning the level was broken.
The inside bar then formed on the next candle. You will notice with the inside bar that the high of the inside bar tested the old support level or the price flip level. This is an important bit of information. See my second chart below for more information. This was price testing the old support and new resistance level and the new resistance level held as a resistance.
Price then formed the inside bar on the daily chart. If price can break the low of the inside bar and make a move lower, the near term support comes in around the 0.69817. Obviously, if price makes a move higher, then the first resistance in the way will be the major daily level overhead.
Daily Chart – Inside Bar

Daily Chart – Price Flip


Leave a Reply