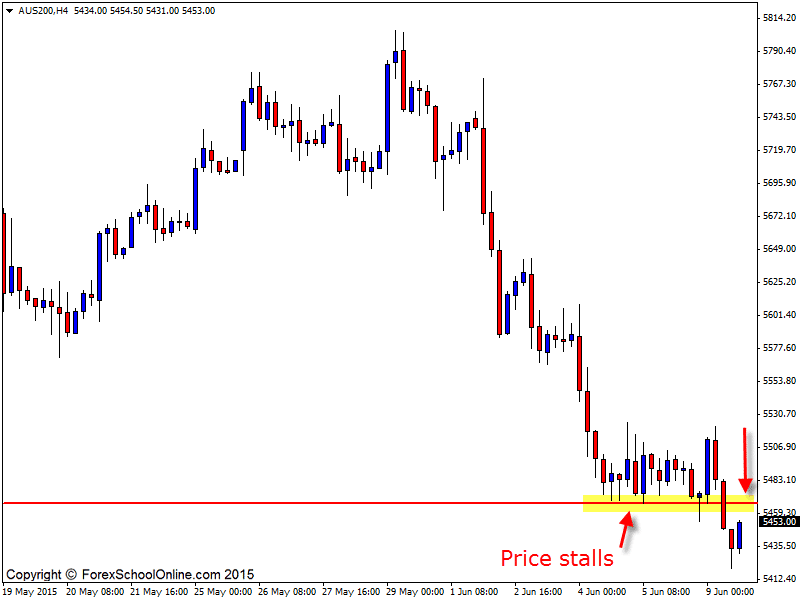
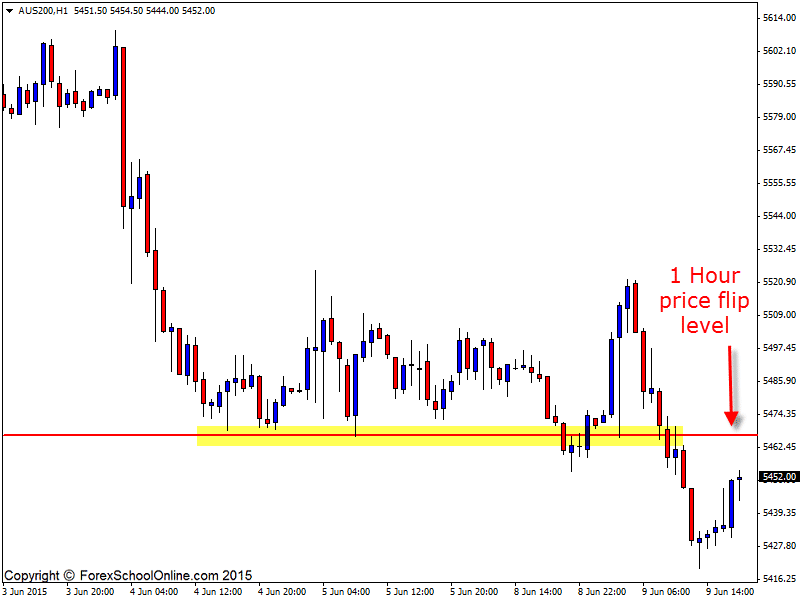
Price on the intraday chart of the Aussie 200 or the Aus200 stock index is rotating back higher and into a really key value area that could be an important hot spot for traders to start hunting short trades.
(When I refer to the intraday I am meaning everything under the daily time frame). Price on the smaller intraday charts such as the 4 hour and 1 hour charts have been in strong down-trends in recent times with price making strong lower highs and lower lows.
For those of you that follow this blog regularly will know; trading in-line with the obvious trend is one of the best things that you can do to start stacking the odds in your favor, especially when the trend is an obvious and strong one like this intraday trend currently is.
If price can make a quick pull-back and into the old support/new resistance area it could present an opportunity to look for potential short trades with the strong down-trend. To confirm any possible trades you would need to see a A+ bearish price action trigger signal at the new resistance level similar to the ones I teach members in the members only Lifetime Membership.
Make sure you keep an eye out on the whole price action story and not just on the last candle or trigger signal. Always remember that the overall price action story is KING and take into account things like; is there enough space to trade into, is the trigger signal sticking out and away, is the trigger signal formed at a value area etc.,
4 Hour Chart

1 Hour Chart

Related Forex Trading Education
– How You Can Make Money Trading Price Action Reversal Signals


Leave a Reply