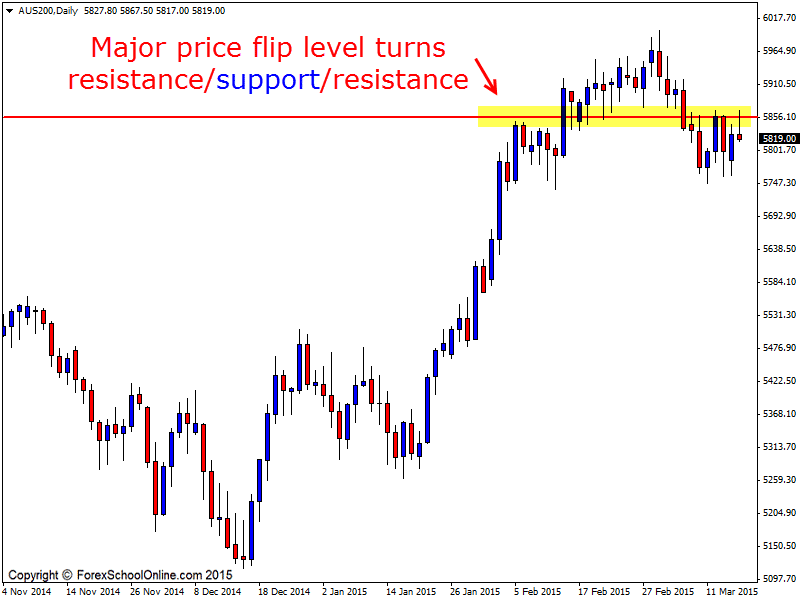
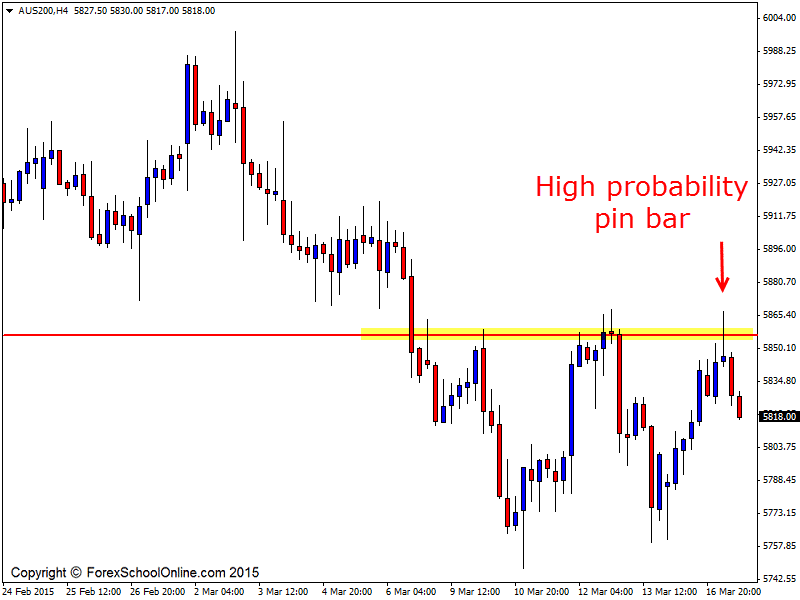
The Aussie 200 Index or the ASX200 has now fallen lower after price fired off a really high probability pin bar on the 4 hour chart. This pin bar was at a value area after price made a retracement back higher and into a key daily price flip resistance.
This key daily area on the Aussie 200 chart is very similar to that of the US30’s key daily price flip area that I discussed late last week in the trade setup’s blog and you can read that here; What to do if the US30 Retraces Back Into a Key Daily Resistance?
These major daily price flip areas can be really high probability areas to look for price action trigger signals to enter reversal trades should the right type of price action present. Often the key can be getting the confirmation that price is going to hold at the new price flip level.
As the 4 hour chart shows below; price has formed a really solid pin bar that is up at the high rejecting the daily resistance level and is sticking up and away from all other price directly around it. This is so important for pin bar reversals – that they stick out and away from all other price and that the nose protrudes clearly up and into either the support or in this case the resistance.
Price has now moved into the first near term resistance. If price continues to move lower the next support comes in on the 4 hour chart around the 5802.20 level and then around the recent swing lows.
Daily Chart

4 Hour Chart


Leave a Reply