The AUDUSD price action stays mostly depressed and presents the least profits to traders at this point. Technical indicators are revealing that market bulls may lack enough strength to effectively fight downward forces. Nevertheless, let’s get a closer look at this market.
Major Price Levels:
Top Levels: 0.6670, 0.6700, and 0.6750
Floor Levels: 0.6640, 0.6600, and 0.6560

AUDUSD Looks Vulnerable Even as Price Action Tries to Retrace Upwards
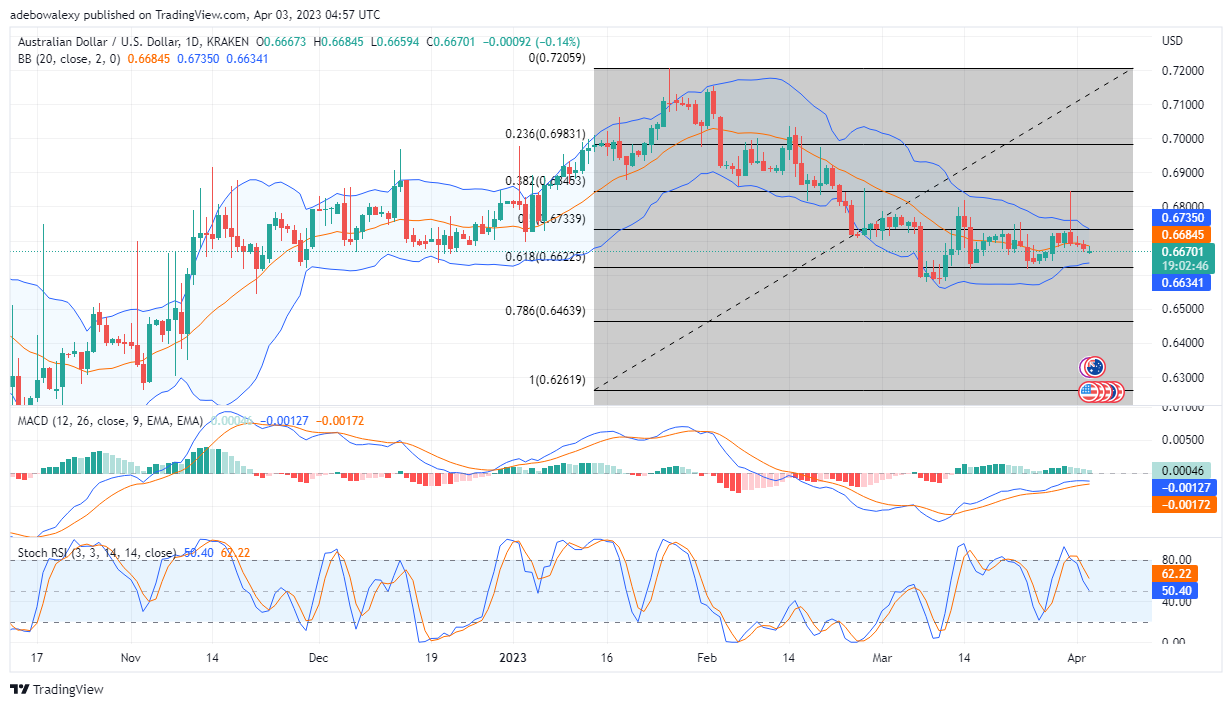
On the daily AUDUSD chart, price action seems to be attempting an upside retracement, almost midway between the Fibonacci levels of 50 and 61.80. Nevertheless, this attempt looks weak. This opinion comes from the fact that the latest green price candle on this chart is an inverted hammer. Consequently, this shows sellers seem to have a considerable grip on price movements. Also, the MACD indicator bars are pale green in appearance, while their line remains below the 0.00 level of the indicator. Furthermore, the Relative Strength Index (RSI) indicator lines are still running downward toward the oversold region. Therefore, this suggests that bulls are still weak at this point.

AUDUSD Stays Mostly Weak on the 4-hour Market
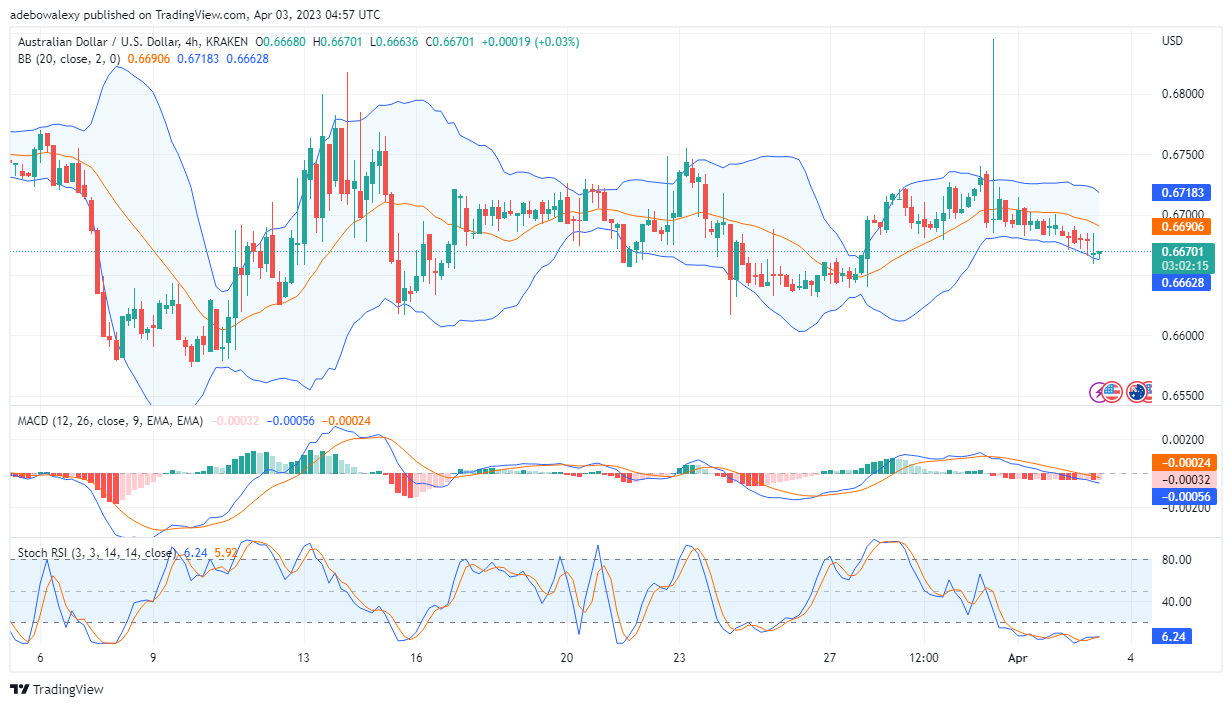
Moving to the 4-hour market, AUDUSD only managed to present very little gain. This can be perceived as two tiny-bodied price candles showing up off the lowest limit of the Bollinger Bands indicator. Also, the MACD indicator curves have just crossed below the equilibrium level, and their lines show no signs of an upside crossover. Additionally, the applied RSI indicator lines look tangled in the oversold zone. From the appearance of the RSI, it seems this market lacks a clear direction at the moment. However, traders can position an entry at 0.6700 to catch an early trend.
Do you want to take your trading to the next level? Join the best platform for that here.


Leave a Reply