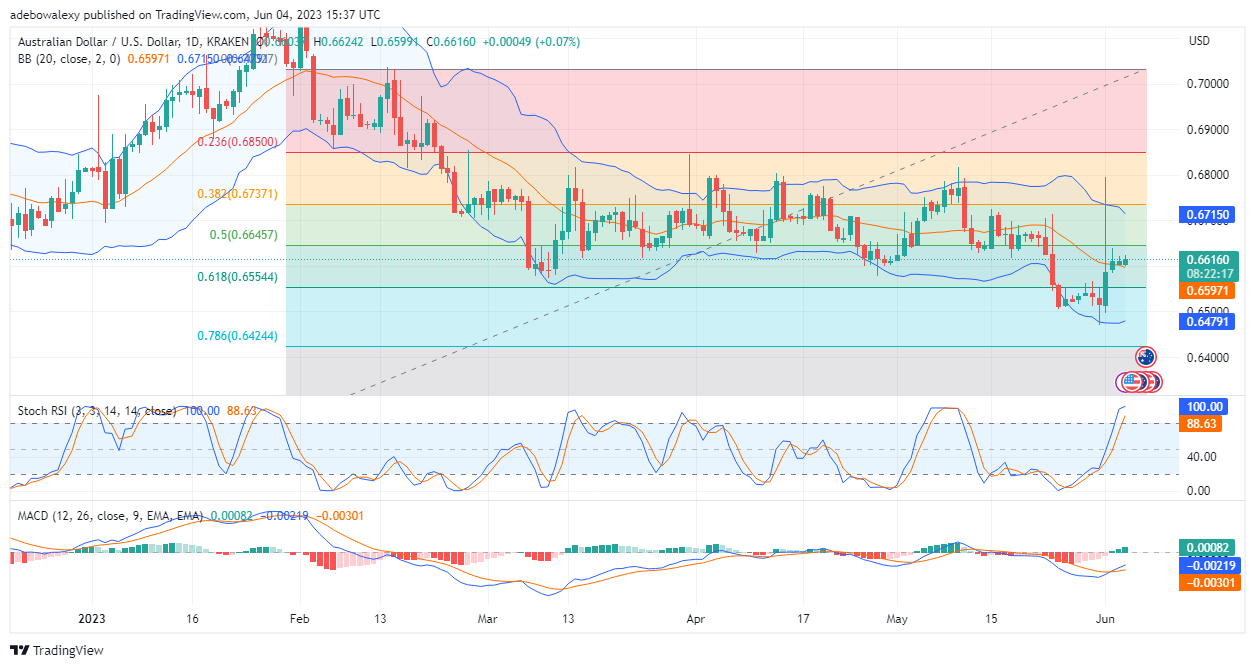
The AUDUSD pair ended last week’s trading activities on a positive note, as the market closed above the 0.6600 price mark. As trading activities begin for the new week, these pairs seem set to record early gains ahead of major economic events, which will dictate the market direction.
Major Price Levels:
Resistance Levels: 0.6616, 0.6646, and 0.6676
Support Levels: 0.6600, 0.6570, and 0.6550

AUDUSD Prepares for More Upside Move
After price action in the AUDUSD daily market crossed above the middle limit of the Bollinger Bands, it appears that the market went short of buyers. Consequently, this caused price action to struggle above the 0.6597 mark, reducing the pace of the upside retracement. Meanwhile, the Relative Strength Index (RSI) indicator has reached deep into the overbought region. Nevertheless, the Moving Average Convergence Divergence (MACD) indicator is still below the equilibrium level of 0.00. The bars of the MACD indicator are green and appear to be getting taller to indicate increasing upside momentum.

AUDUSD Is Well Positioned to Welcome Tailwinds
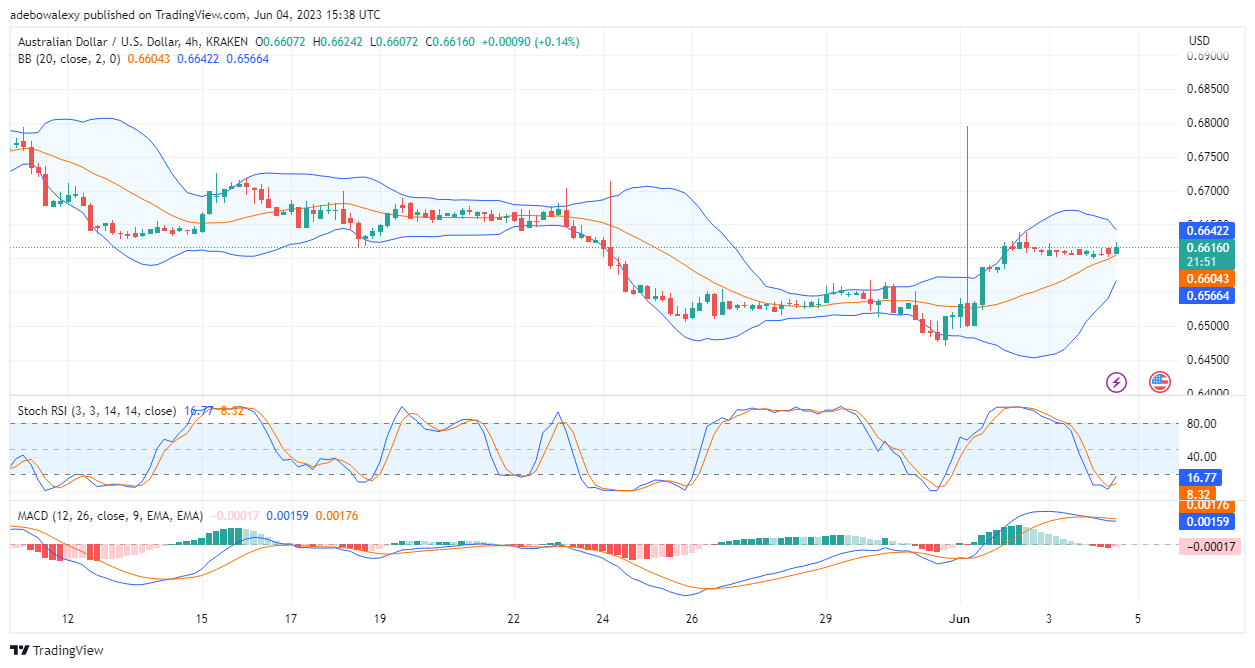
In the 4-hour market, it could be seen that trading indicators are still showing positive indications. The upper and lower bands of the Bollinger Bands indicator are contracting. Meanwhile, the last green price candle here sits above the middle band of the Bollinger Bands indicator. Also, the RSI has recently performed a bullish crossover in the oversold region of the indicator. In addition, traders should pay attention to the appearance of the bars of the MACD indicator, as the last one here is now pale red, indicating that buying momentum can now increase in this market. Therefore, traders can anticipate a retracement of 0.6650 ahead of economic events.
Do you want to take your trading to the next level? Join the best platform for that here.


Leave a Reply