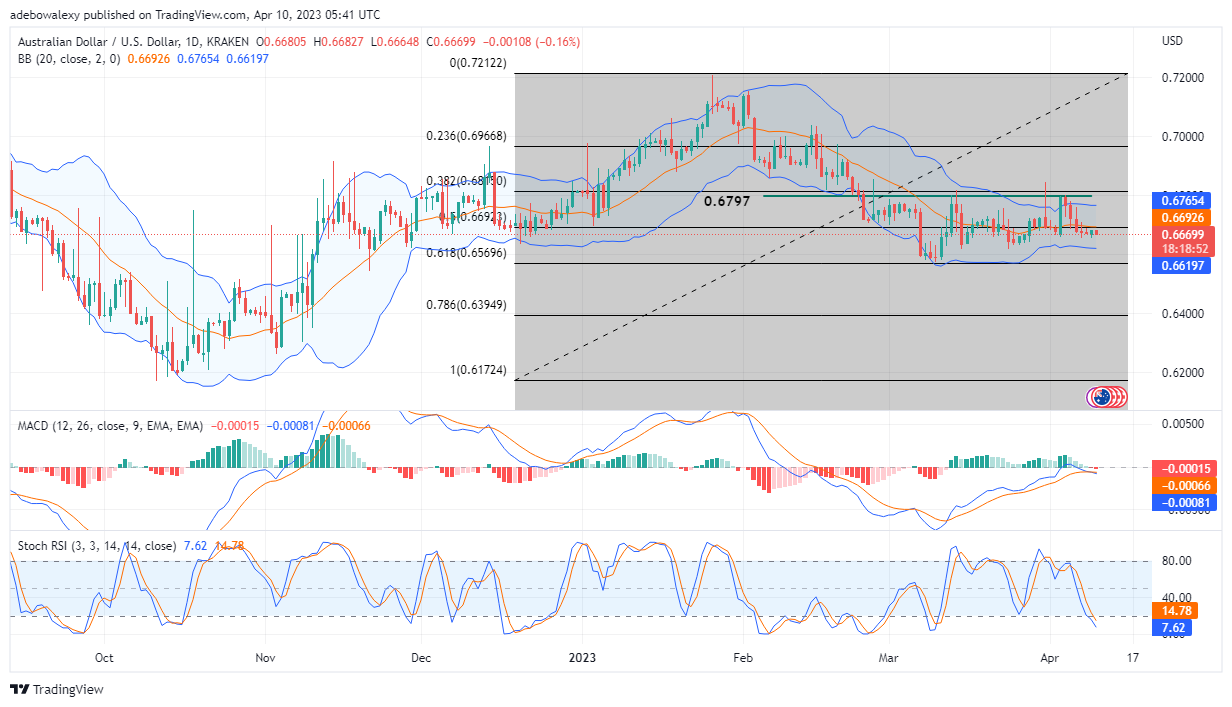
After price action in the AUDUSD market hit the 0.6797 mark during seven sessions, it appears that price action triggered a lot of short orders. Consequently, this causes the pair’s price to fall below the 0.6692 market price. Let’s further examine the price movements in this market to know where prices may head.
Major Price Levels:
Top Levels: 0.6669, 0.6685, and 0.6725
Floor Levels: 0.6649, 0.6619, and 0.6600

AUDUSD Stays Depressed Below the Price Level of 0.6692
On the daily market, the AUDUSD price action seems to be consolidating below the price mark of 0.6692. At this point, the last price candle is bearish, which shows that traders are going short on this pair. Also, the Moving Average Convergence Divergence (MACD) indicator curve has done a bearish crossover at the sub-0.00 level. Meanwhile, the applied Relative Strength Index (RSI) lines are still sliding into the oversold region. All the signs observed from trading indicators on this front show that the pair remains bearish and prices may fall lower.

Is AUDUSD Quietly Gaining Momentum?
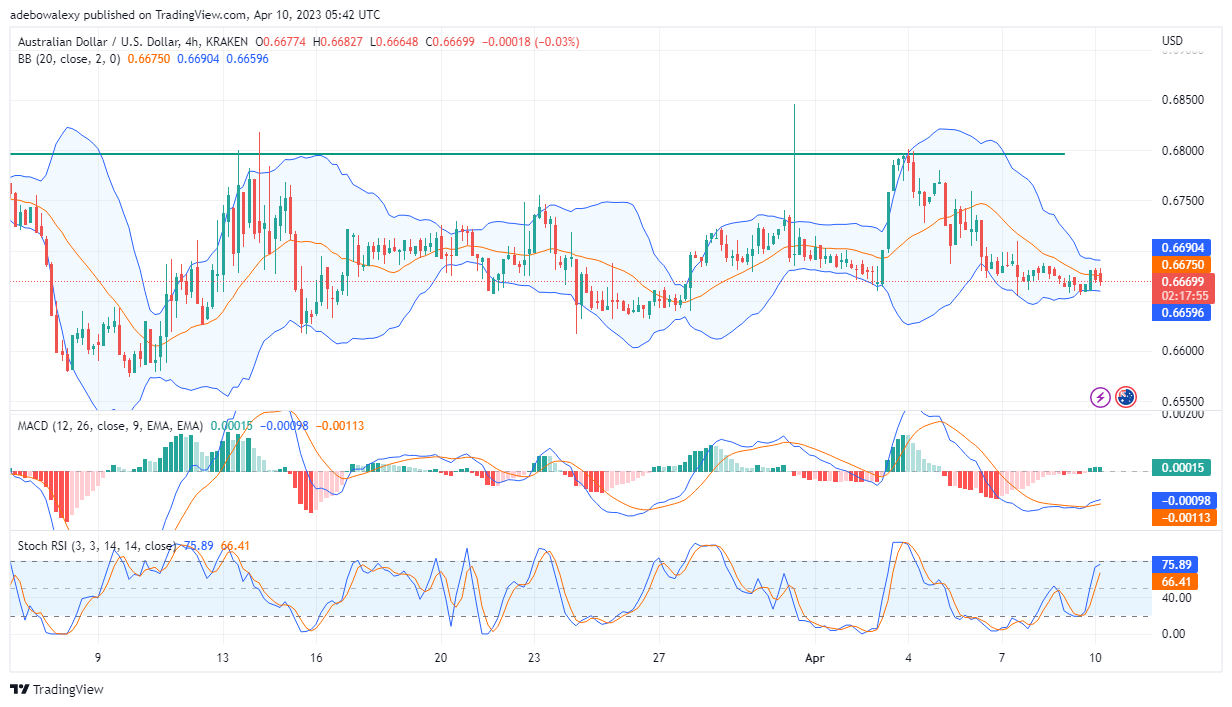
On the AUDUSD 4-hour market, it appears that in the past three trading sessions, traders have gathered some minimal profits. However, since the previous trading session until now, short orders have started going on. Consequently, this has pushed the price back below the 0.6675 price level. This has placed the AUDUSD’s current price below the middle band of the Bollinger Bands indicator. Nevertheless, the RSI and MACD indicators are still portraying much of the past price upside move. The bars of the MACD stayed green up until the ongoing session. Meanwhile, the RSI leading curve is reflecting the recent losses as it is bent sideways in an attempt for a bearish crossover. The best approach here is to lie in wait for any developments. Traders can place an entry at the 0.6695 price mark for any favorable development..
Do you want to take your trading to the next level? Join the best platform for that here.


Leave a Reply