The AUDUSD pair appears to have hit a pause as its price action started consolidating towards the close of last week’s trading activities. Meanwhile, technical indicators suggest that bullish momentum may be growing stronger. Therefore, this sets a bearish tone for this market as we enter a new trading week.
Key Price Levels:
Resistance Levels: 0.6700, 0.6800, and 0.6900
Support Levels: 0.6653, 0.6600, and 0.6550

AUDUSD Eyes Lower Support
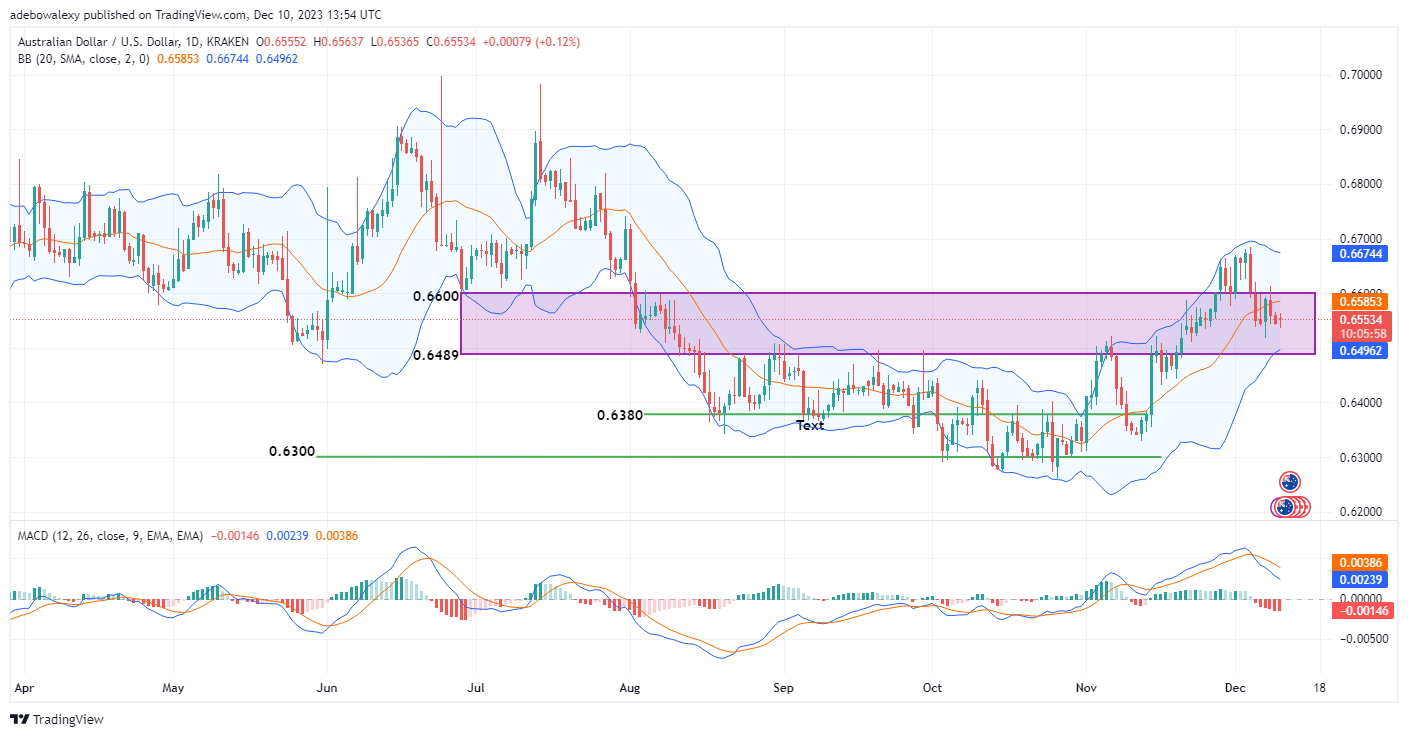
AUDUSD’s daily market chart suggests that bears may be preparing to continue pushing prices further downward. It can be observed that price action has fallen below the Bollinger Bands’ MA, indicating that bears may strengthen at this point. This might embolden short traders, leading to more downward corrections.
Additionally, the applied Moving Average Convergence Divergence (MACD) indicator lines have maintained a downward path following the recent crossover. The bars of this indicator are still solid red, signifying that bears are displaying strength. Nevertheless, the last session appears to be experiencing some resistance on its downward track.

AUDUSD Bulls Are Trying to Mount Pressure
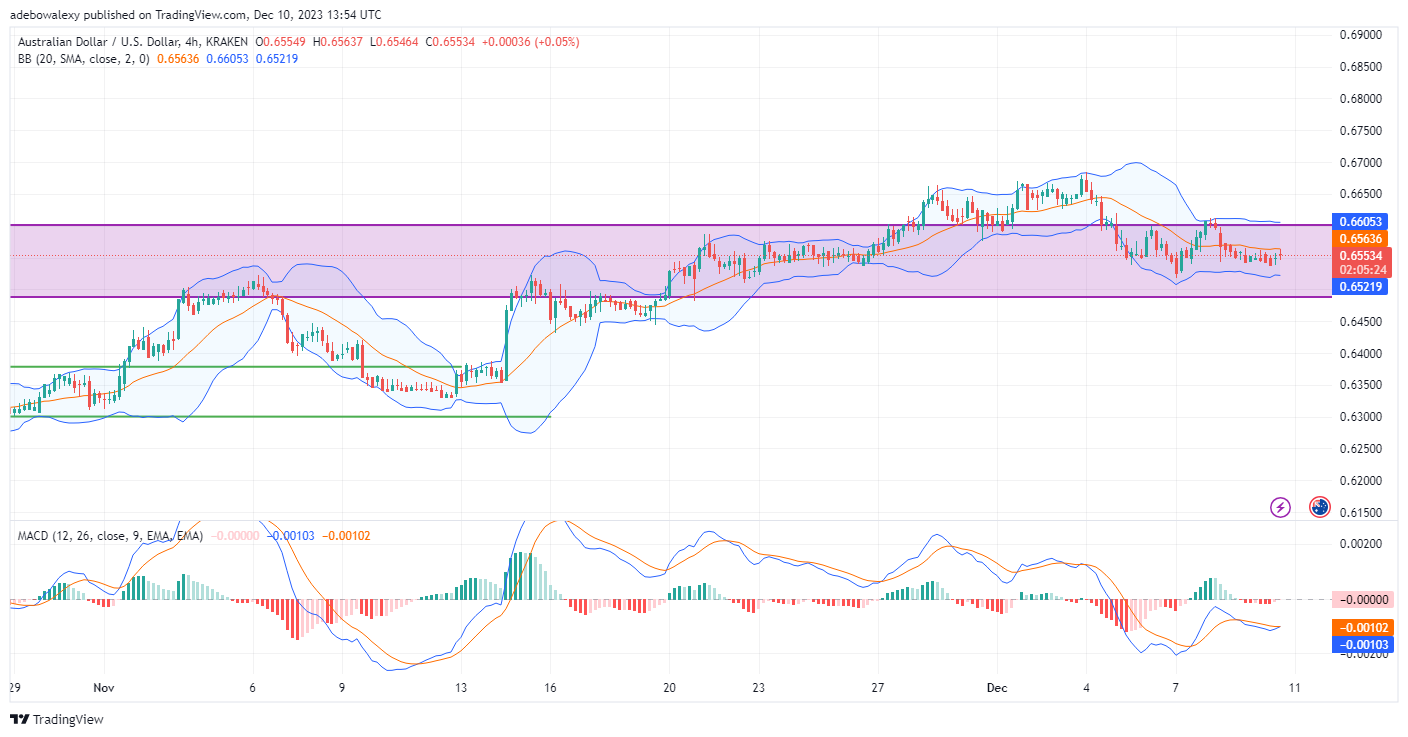
In the AUDUSD 4-hour market, there’s a sense that buyers are making modest efforts. Despite a minor downward correction, the last bearish price candle is forming above the previous green one. However, the MACD indicator lines have displayed an upside crossover from below the equilibrium level.
It’s essential to note that price activities are still below the Bollinger Bands MA line. Consequently, this tentatively maintains that bears may still be in charge of price movements. Therefore, traders may want to anticipate a continued downward correction towards 0.6520 ahead of any market-influencing fundamentals.
Do you want to take your trading to the next level? Join the best platform for that here.


Leave a Reply