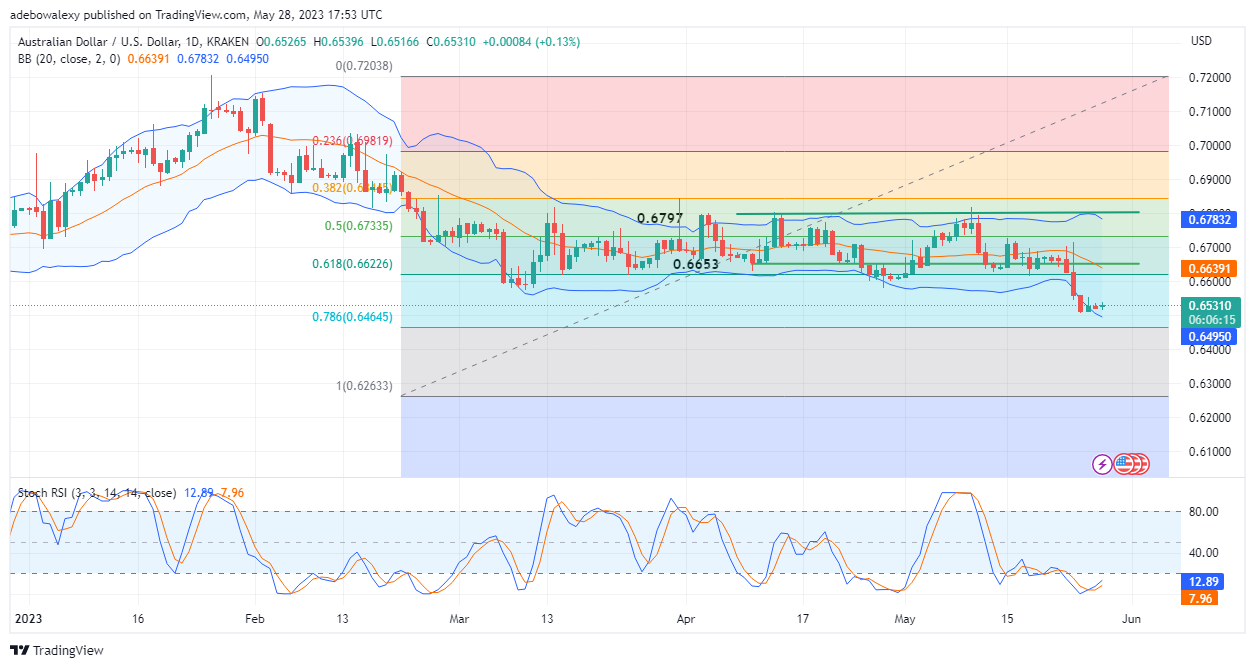
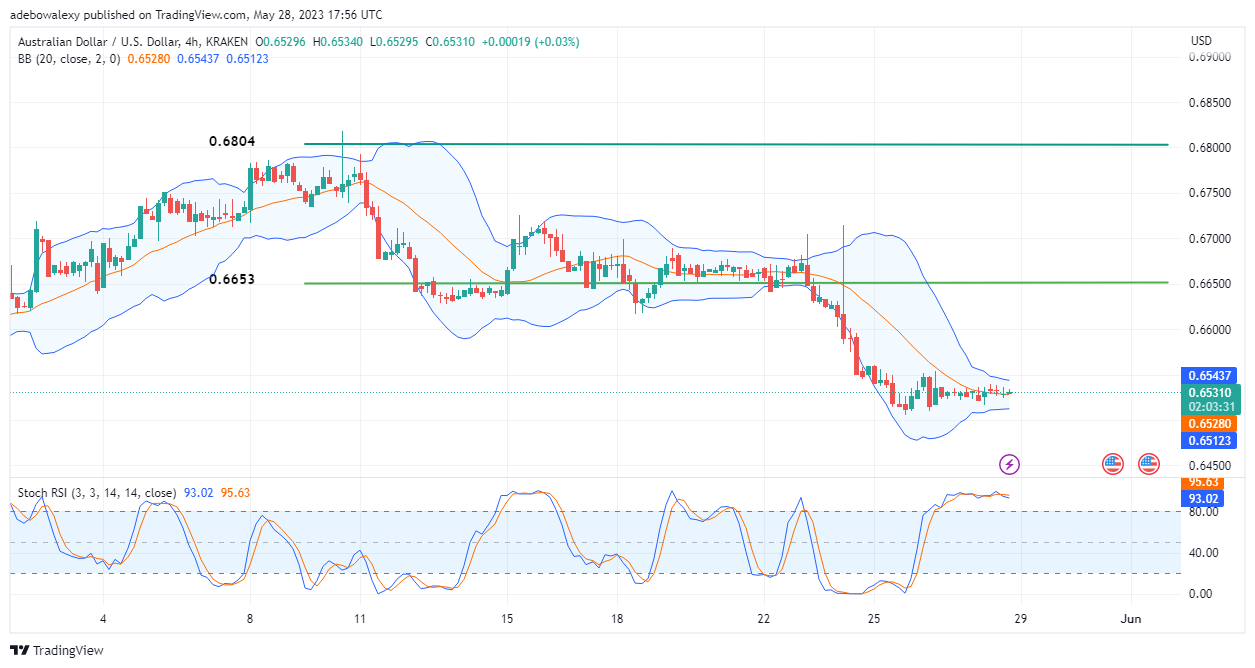
The AUDUSD starts the week with a minimal upside rebound in an upward direction near the 0.6500 price mark. Indications from trading indicators are suggesting that price action may gather more upside traction as trading activities continue during the week.
Major Price Levels:
Resistance Levels: 0.6531, 0.6600, and 0.6650
Support Levels: 0.6500, 0.6450, and 0.6400

AUDUSD Retraces Towards the 0.6550 Price Mark as a Short-Term Resistance
Price action in the AUDUSD market has started on a profitable note, as price action seems to have bounced off support near the 0.6500 mark. As of the time of writing, the pair’s price stands at 0.6531. Furthermore, the Relative Strength Index (RSI) indicator curves have extended their upside move after performing a bullish crossover during one of the trading sessions last week. Consequently, this shows that upside forces are gaining momentum even as these curves are still in the depths of the oversold region.

AUDUSD Seems to Be Preparing for a Considerable Upside Retracement
Extending this study to the 4-hour market seems to be raising suspicion that price action may be preparing for a significant upside move. Here, the upper and lower bands of the Bollinger Bands indicators have contracted significantly. Meanwhile, price action seems to have picked a support level above the middle band of the Bollinger Bands indicator. Also, this last price candle is an inverted hammer price candle and suggests an impending upside move combined with the behavior of the Bollinger Bands. However, the RSI curves have remained in the overbought region and appear to be trending sideways there. Nevertheless, it’s more likely that with the arrival of more economic data as the week’s financial activities resume, price action may gain more momentum as the price moves towards the 0.6600 price mark.
Do you want to take your trading to the next level? Join the best platform for that here.


Leave a Reply