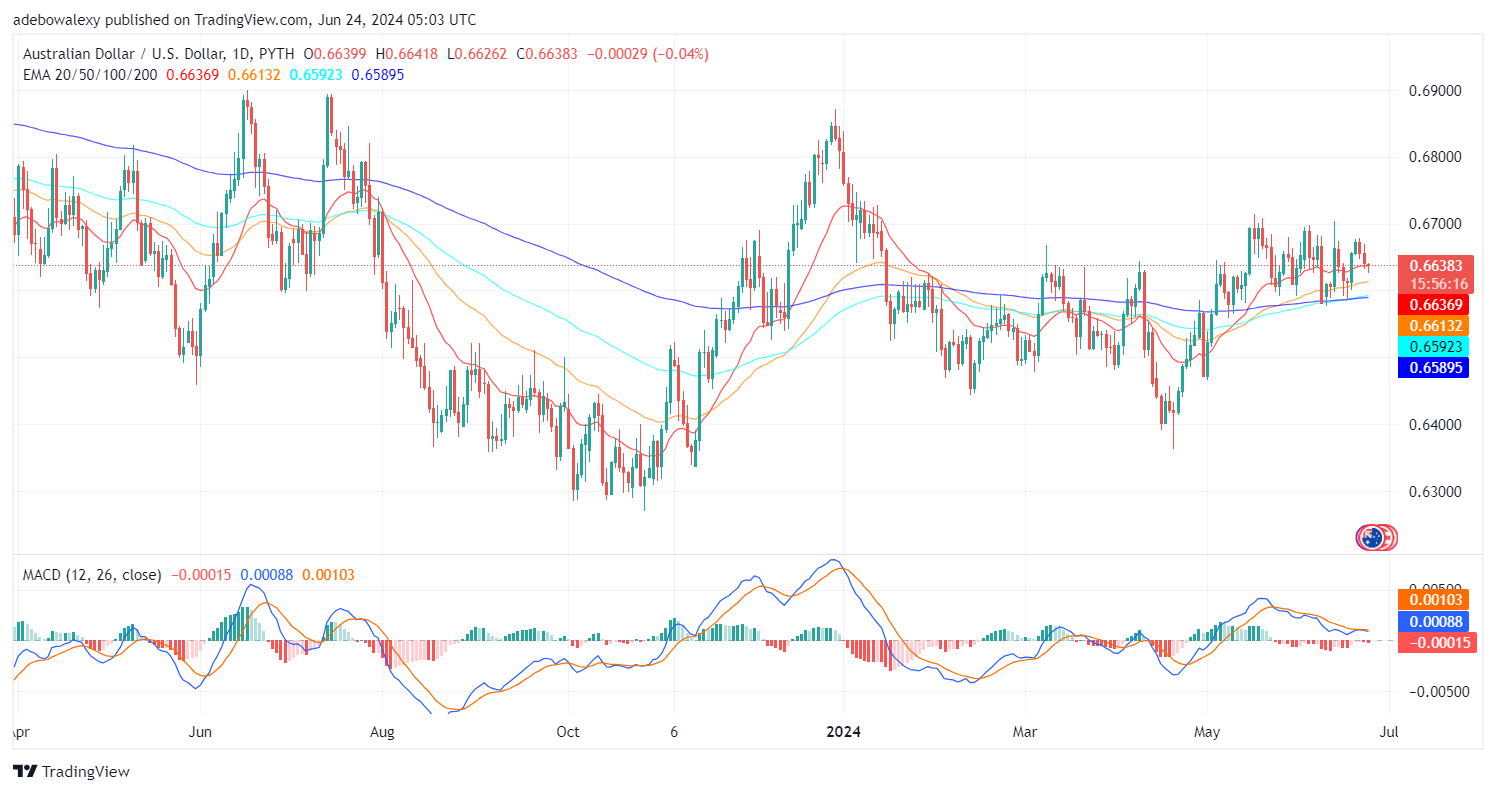
The AUDUSD pair has seen a moderate downward correction as the market turned south towards the close of the previous week’s trading activity. This is happening at a time when the global PMI isn’t performing at its best. Additionally, the USD is under pressure from risk aversion as interest rates are set to decline starting in September.
Key Price Levels:
Resistance Levels: 0.6700, 0.6800, and 0.6900
Support Levels: 0.6600, 0.6500, and 0.6400

AUDUSD Lands on Crucial Support
As noted earlier, the AUDUSD price action has been corrected downward. At this point, the market has landed on crucial support at the 20-day Exponential Moving Average (EMA) curve. Meanwhile, the last price candle representing the ongoing session has appeared as a hammer-shaped price candle, aligning with the possibility of an upside bounce off the EMA support.
However, the Moving Average Convergence Divergence (MACD) lines have risen above the equilibrium level but now have a sideways bearing. The bars of the indicator below the equilibrium level are solid red, which seems to negate the hope of a bullish reversal at this point in the market.

AUDUSD Upside Forces Are Pulling Some Strings
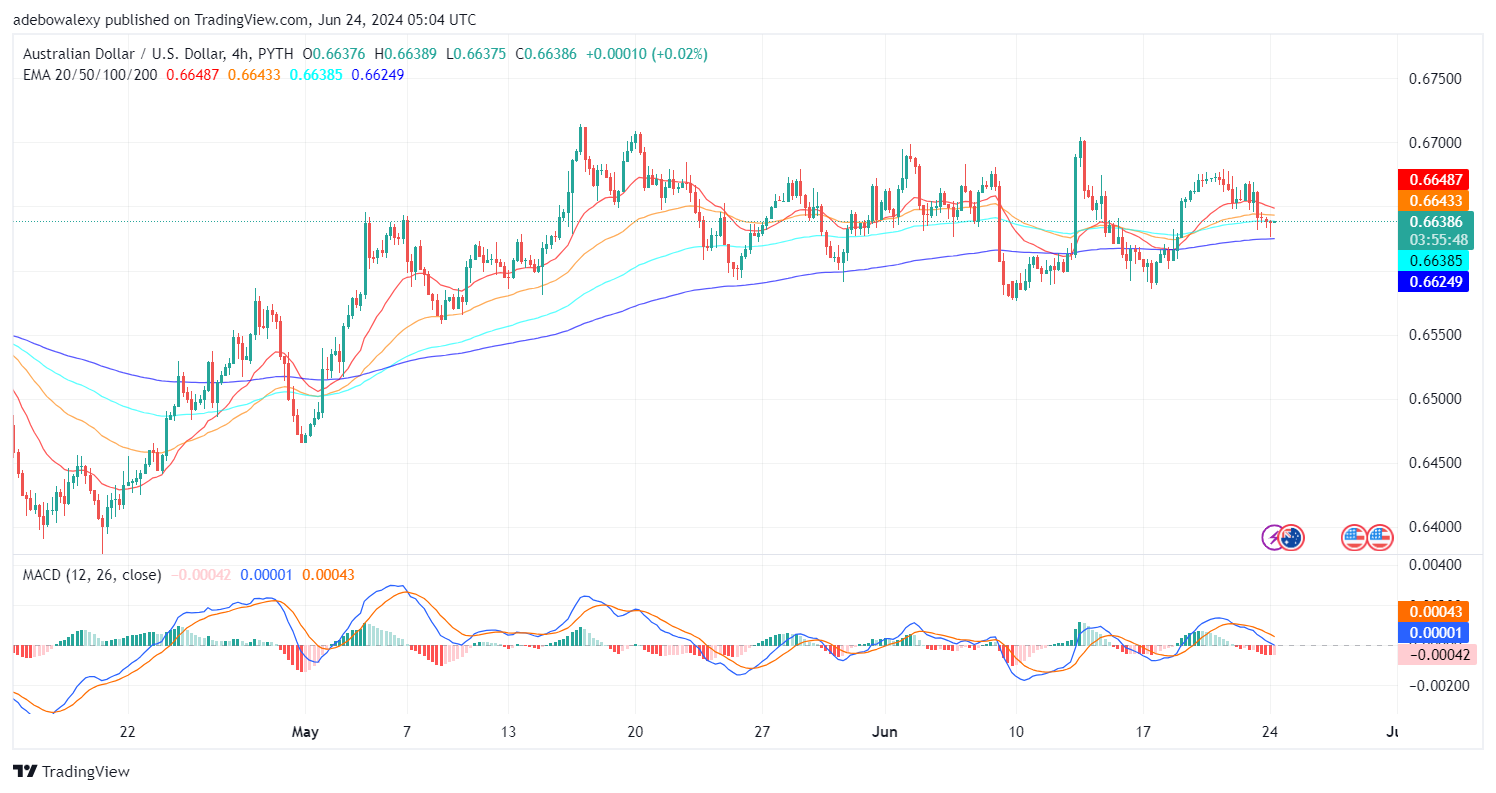
It has been noted that the AUDUSD market seems aligned for a rebound. Additionally, the 4-hour market has further shown that the market may be getting ready to take off. The last price candle here can be seen appearing as a dash price candle and sits just above the 100-day EMA line.
Although this hasn’t presented much movement, the last bar on the MACD indicator suggests that downward forces are now weaker. Therefore, upside forces now have the chance to stage a rebound off the found support level, towards the 0.6700 mark. However, traders may still have to pay attention to data that may influence the price movement.
Do you want to take your trading to the next level? Join the best platform for that here.


Leave a Reply