AUDUSD Kill Zone
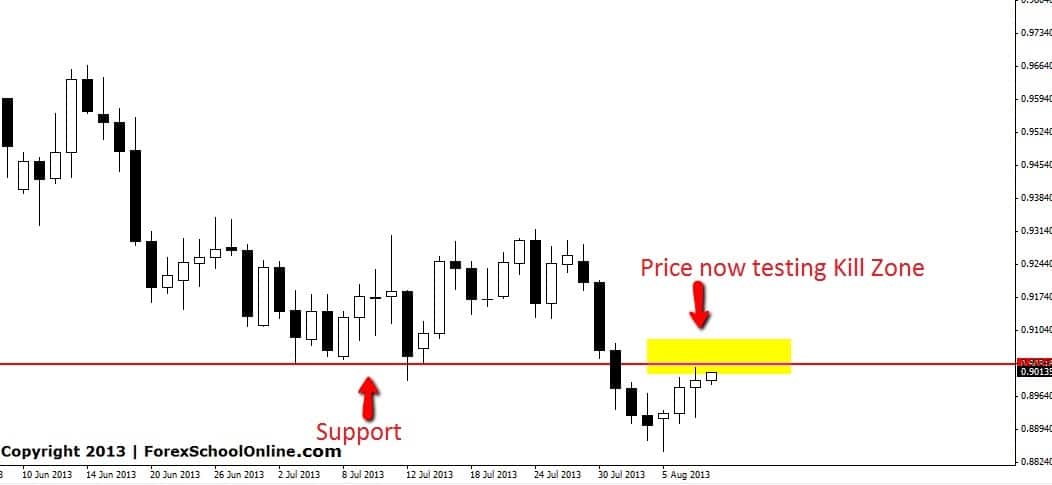
Price on the AUDUSD is moving closer into the kill zone on the daily chart. Price is an a down trend on this pair on the daily chart and is one of the few Forex pairs trending at all at the moment. Price has found the bottom and is retracing higher to retest the old support area which has now flipped and could act as a new resistance level. To learn about price flips and kill zones read here: Price Action Kill Zones.
Price Action traders could be watching this kill zone on the daily chart and higher time frames such as 8hr and 12hr for price action clues and signals. If traders want to learn how to change their MT4 charts to make any time frame chart they wish they can read this tutorial HERE. If price action gives off large bearish price action signals it could represent a high probability opportunity to make a short trade with the trend at a logical key level. It is important traders get a valid price action action signal as confirmation that there is a valid trade to be taken. If price action is showing that this level is about to give way. price could break through and move higher signalling a possible short term trend higher.
AUDUSD DAILY CHART | 8TH AUG 2013

CADCHF Daily Bearish Engulfing Bar
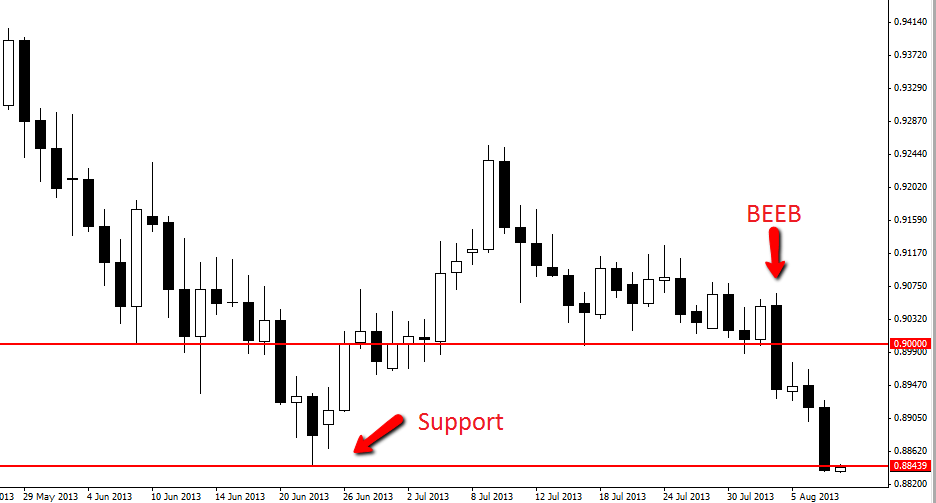
Recently in this blog I posted about the Bearish Engulfing Bar (BEEB) on the daily chart of the CADCHF. We made a strong point of how important it was for price to break the low if price was any chance to break and move lower over the coming sessions. To read the original post see HERE.
Once price broke that low it shot lower and has now moved dramatically lower into the near term lows. Price is now testing support and at a major low. This low is at the bottom of what has been a huge leg lower and a strong bearish move. If price can break this low and continue moving lower a major down-trend may set in and another huge leg lower may be on the cards.
CADCHF DAILY CHART 8TH AUG 2013


Leave a Reply