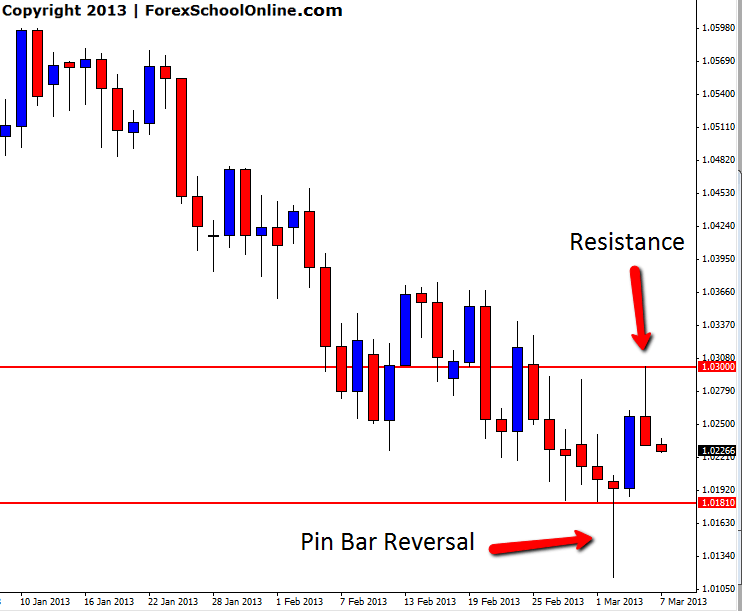
After posting about the Pin Bar Reversal on the daily chart in this blog, price burst higher to push into the resistance and round number of 1.0300. To see this previous post see Here: AUDUSD Pin Bar Reversal
Once price broke the high of the pin bar it moved higher before reaching resistance and moving back lower. In the chart below we can see price has now rejected resistance solidly and formed a rejection candle.
The traders who took this trade were given a great chance to take profit or at the very minimum protect their capital and move to break even
AUDUSD DAILY CHART – 7TH MARCH 2013


Leave a Reply