AUDUSD | 30 MAY 2013
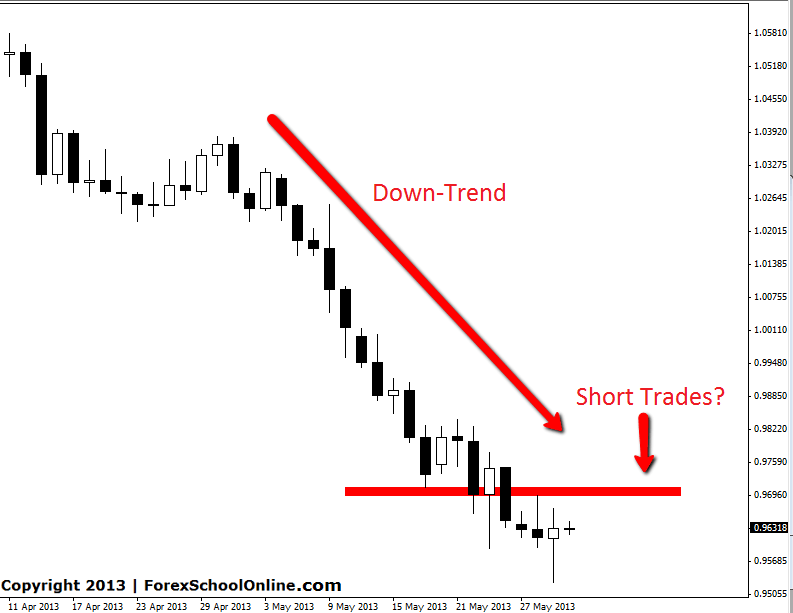
The AUDUSD has formed a bullish rejection Pin Bar Reversal down at a swing low on the daily chart. This Pin Bar is right down at the extreme low and sticking out and away from all other price how we like to see rejection candles, however this setup is highly counter trend. All the recent trend and momentum has been lower and this Pin Bar is signalling price to move back higher.
The best play in this market may be to wait to see if price does make a move higher and look to get into any short trades from the move into resistance. Short trades would then be getting into logical trades from critical levels and trading with the trend in their favour.
The chart below shows the first level that price action traders could possibly target to look for short trades should price pop higher.
AUDUSD DAILY CHART

OIL | 30 MAY 2013
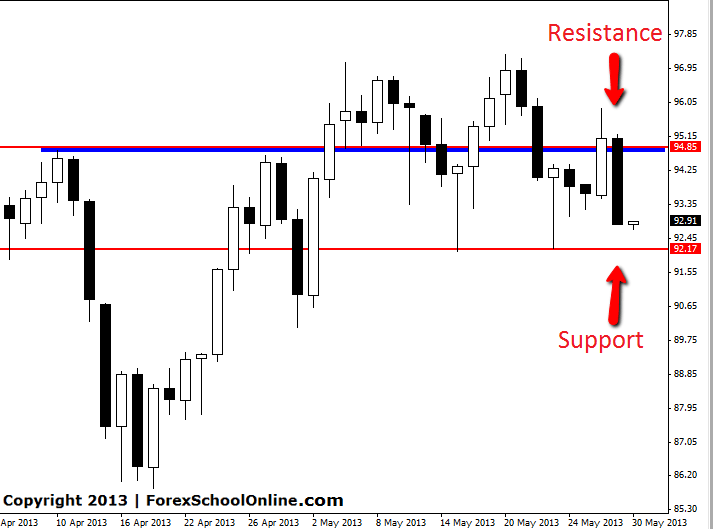
Earlier this week we spoke about a Pin Bar reversal that had formed on the Oil market. To read the post see here: Oil forms super Pin Bar In that post we spoke about that market having a very close first resistance level overhead that traders needed to be mindful of.
Price eventually did break the Pin Bar high and attempt to move higher only to run into a brick wall which was this overhead resistance we had identified in the first post. In the overnight session price has experienced a heavy sell off and has closed well off it’s lows. If price continues to sell off the next support comes in around 92.15.
OIL DAIL Y CHART


Leave a Reply