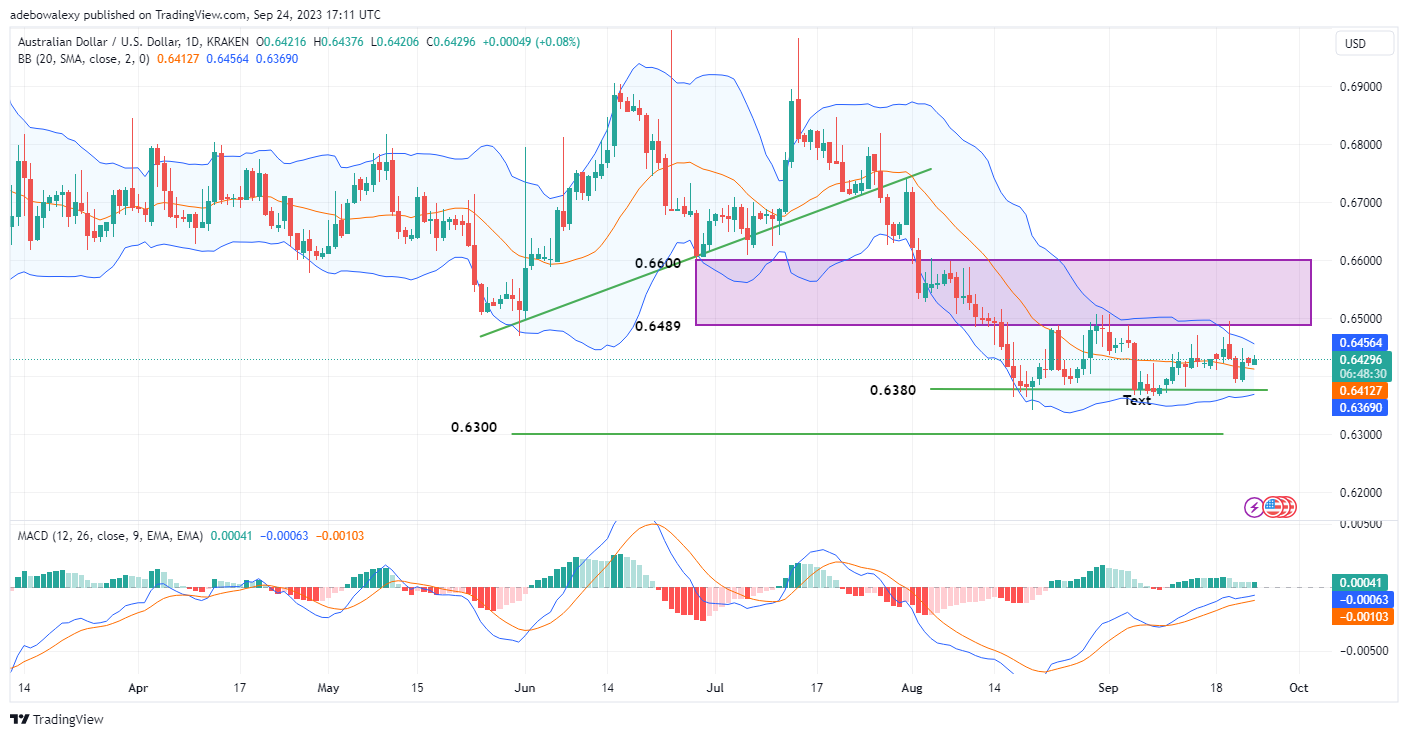
Last week’s trading for the AUDUSD pair ended on a fair note. The price action for the pair was able to recover its position above key support at the 0.6412 price mark. Consequently, this points out that, given stable fundamentals on the USD side, more upside grounds may be recovered.
Major Price Levels:
Resistance Levels: 0.6429, 0.6456, and 0.6500
Support Levels: 0.6400, 0.6350, and 0.6300

AUDUSD Set to Leap off a Key Support
As earlier mentioned, the closing session in the AUDUSD market ended with price action sitting just above the MA of the Bollinger Bands indicator. Also, the Moving Average Convergence Divergence MACD indicator lines continue to journey upwards and towards the equilibrium level, while the last bar of this indicator has turned vivid green. Therefore, all technical observations concerning this make it seem like price action may continue its upside correction.

AUDUSD Maintains a Fair Chance of Extending Its Upward Price Movement
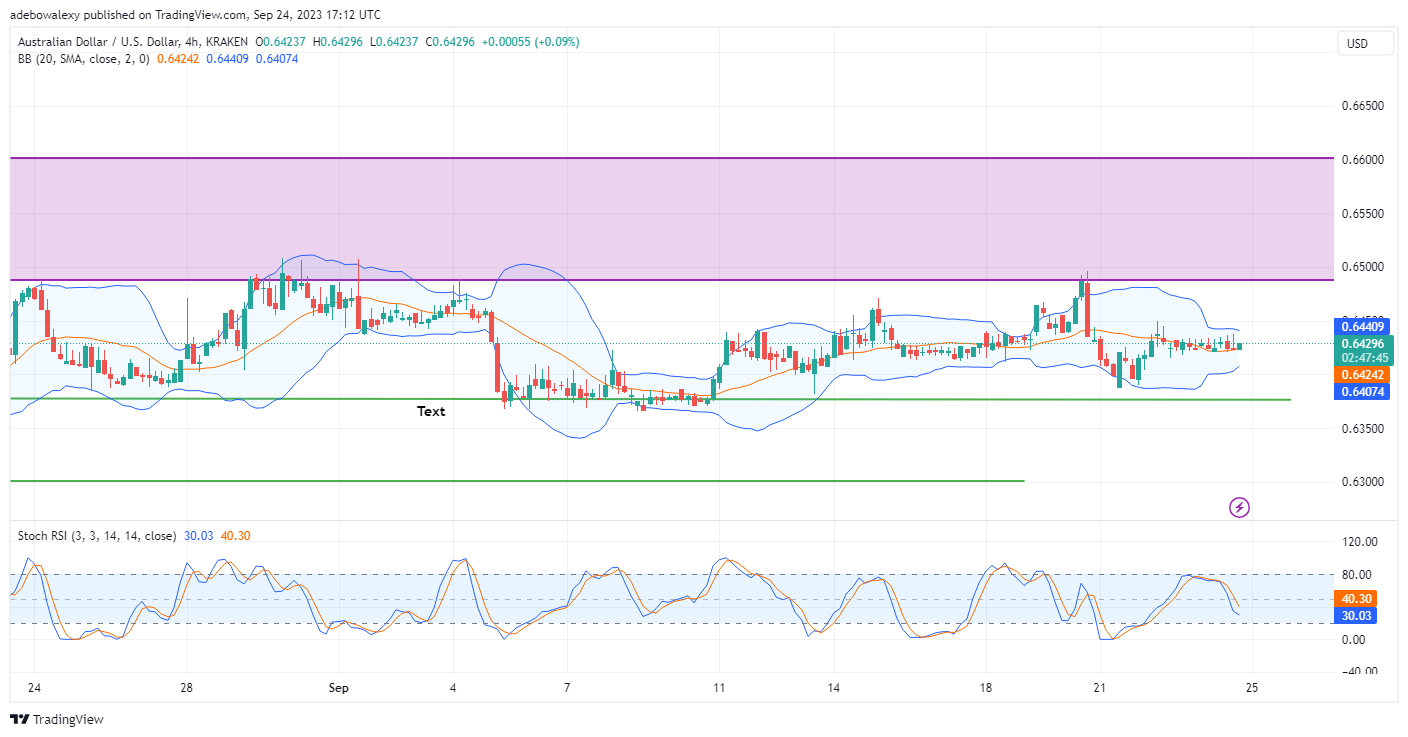
Coming to the AUDUSD 4-hour market, the last price candle on this market chart remains positioned above the middle band of the Bollinger Bands indicator. Likewise, the session represented by this price candle remains under the control of buyers. However, the Relative Strength Index (RSI) indicator lines have been falling towards the oversold zone.
Nevertheless, a close examination of the leading line here shows that the it is correcting sideways in response to the presented profit in the ongoing session. Therefore, traders may anticipate the pair to continue towards the 0.6500 mark ahead of meaningful economic developments in the US.
Do you want to take your trading to the next level? Join the best platform for that here.


Leave a Reply