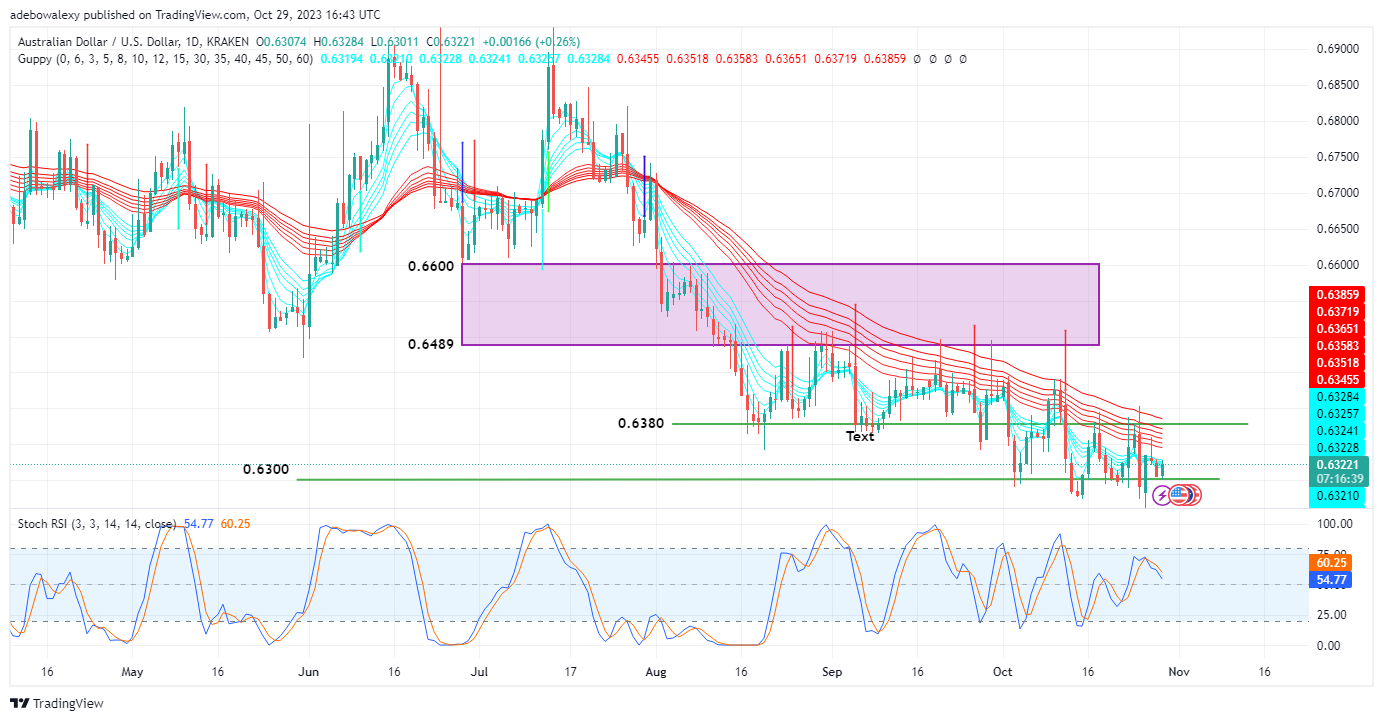
The past week’s trading activities concluded with the AUDUSD market experiencing a rebound from the 0.6300 price level. It seems to be the second bounce off this level after a recent fakeout. The question remains: will price action continue to extend the upside correction off this support?
Key Price Levels:
Resistance Levels: 0.6322, 0.6400, and 0.6478
Support Levels: 0.6300, 0.6250, and 0.6200

AUDUSD Struggles to Break the Support at the 0.6300 Mark
Since August, the AUDUSD market has been establishing lower lows, yet the support at 0.6300 remains strong. Last week’s trading session concluded with a bounce off the 0.6300 support.
However, the pair still trades below the Guppy Multiple Moving Average curves. Similarly, despite the bounce, the Relative Strength Index (RSI) indicator lines are gradually descending towards the mark. Consequently, traders may need to rely more on the pair’s fundamentals for additional momentum at this stage.

AUDUSD Shows Positivity on a Smaller Scale
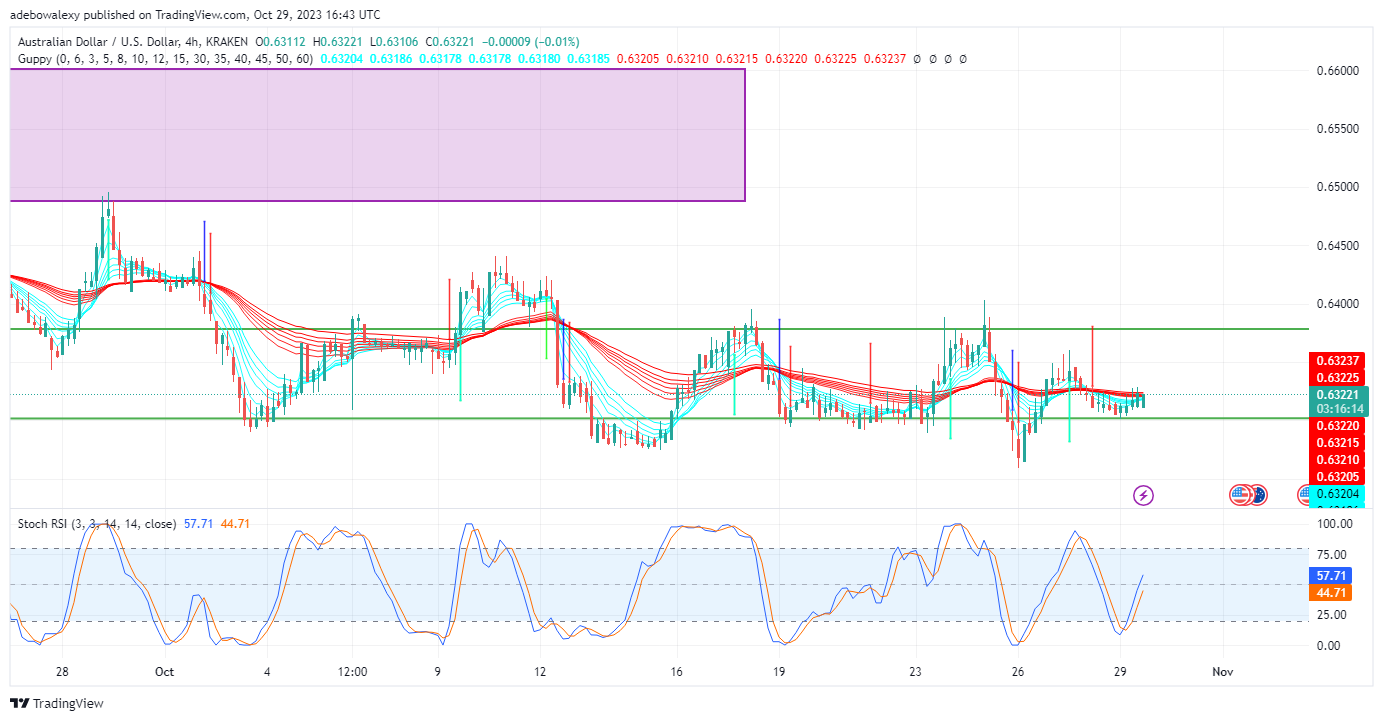
On the AUDUSD 4-hour market, it is evident that price action has gradually surpassed the GMMA curves over the last four trading sessions. Additionally, from the previous trading session, the price action has surpassed some of the red GMMA lines.
Simultaneously, the RSI lines have been steadily ascending beyond the 50 mark of the indicator. Consequently, this indicates the possible building of upward momentum in the market, possibly leading prices towards the 0.6420 mark. Nonetheless, as mentioned earlier, fundamental factors will significantly influence the market direction in the upcoming week.
Do you want to take your trading to the next level? Join the best platform for that here.


Leave a Reply