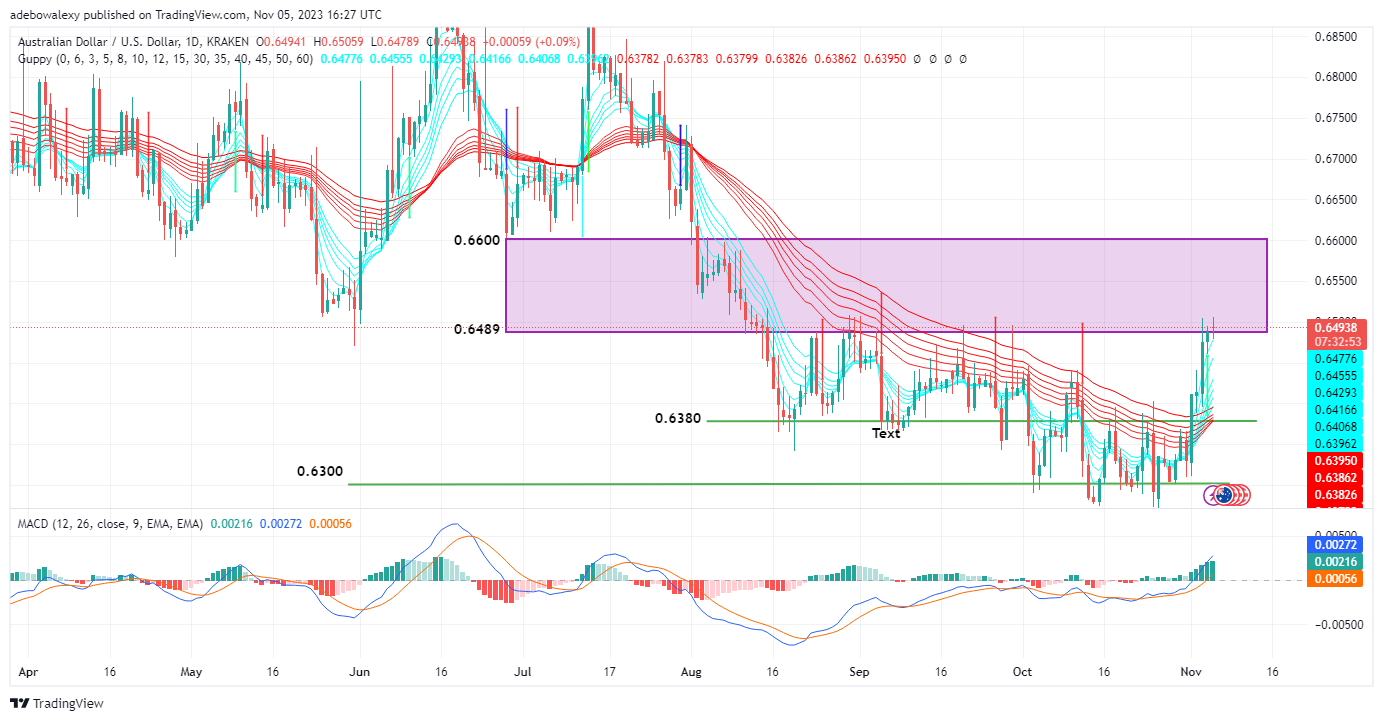
During last week’s trading activities, the AUDUSD market witnessed a significant price surge. Consequently, this propelled the token through the resistance at the 0.6380 mark. Subsequently, the market continued its upward trajectory, now trading above the $0.6480 threshold.
Key Price Levels:
Resistance Levels: 0.6494, 0.6550, and 0.6650
Support Levels: 0.6450, 0.6400, and 0.6350

AUDUSD Encounters a Barrier at the $0.6500 Mark
Price action in the AUDUSD daily market tested the 0.6500 resistance level but experienced a slight downward bounce. The last price candle on the chart is red, yet it has a very small body. This indicates a resistance encounter during Friday’s trading session.
However, prices continue to remain above the Guppy Multiple Moving Average lines, signifying the potential for bullish momentum in this market. Similarly, the Moving Average Convergence Divergence (MACD) indicator’s lines are rising above the equilibrium level with green bars, suggesting a possible upward trend unless impacted by significant fundamentals.

AUDUSD Potentially Finds Support at 0.6480
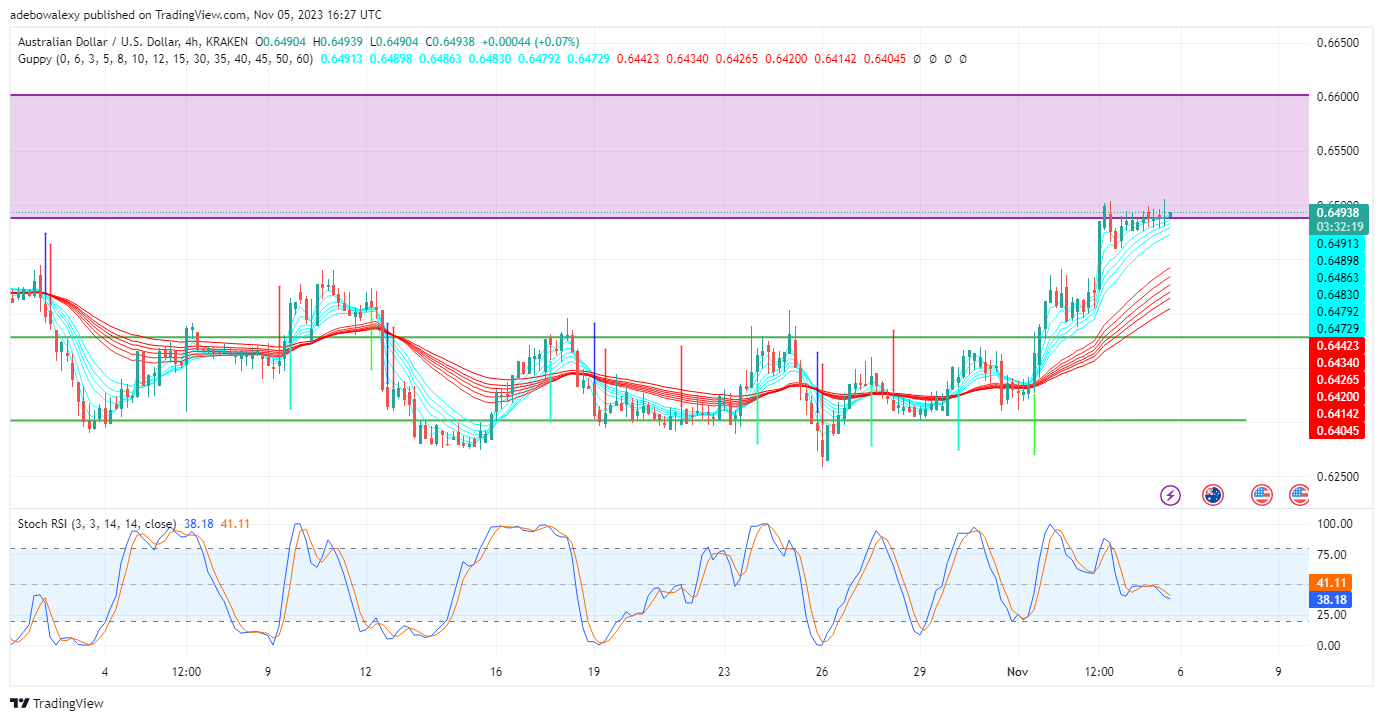
The AUDUSD 4-hour market sheds light on the pair’s recent developments. The last price candle, representing the closing 4-hour period of the previous week’s trading session, appears green and is positioned just above the 0.6489 mark. Trading activities persist above the GMMA lines.
Meanwhile, the RSI indicator lines are slightly trending downward toward the 20 mark, indicating divergent market signals within this time frame. Traders may hold their positions with caution, anticipating a potential extension towards the 0.6550 mark. However, they should consider exiting if the price action falls below the 0.6400 mark.
Do you want to take your trading to the next level? Join the best platform for that here.


Leave a Reply