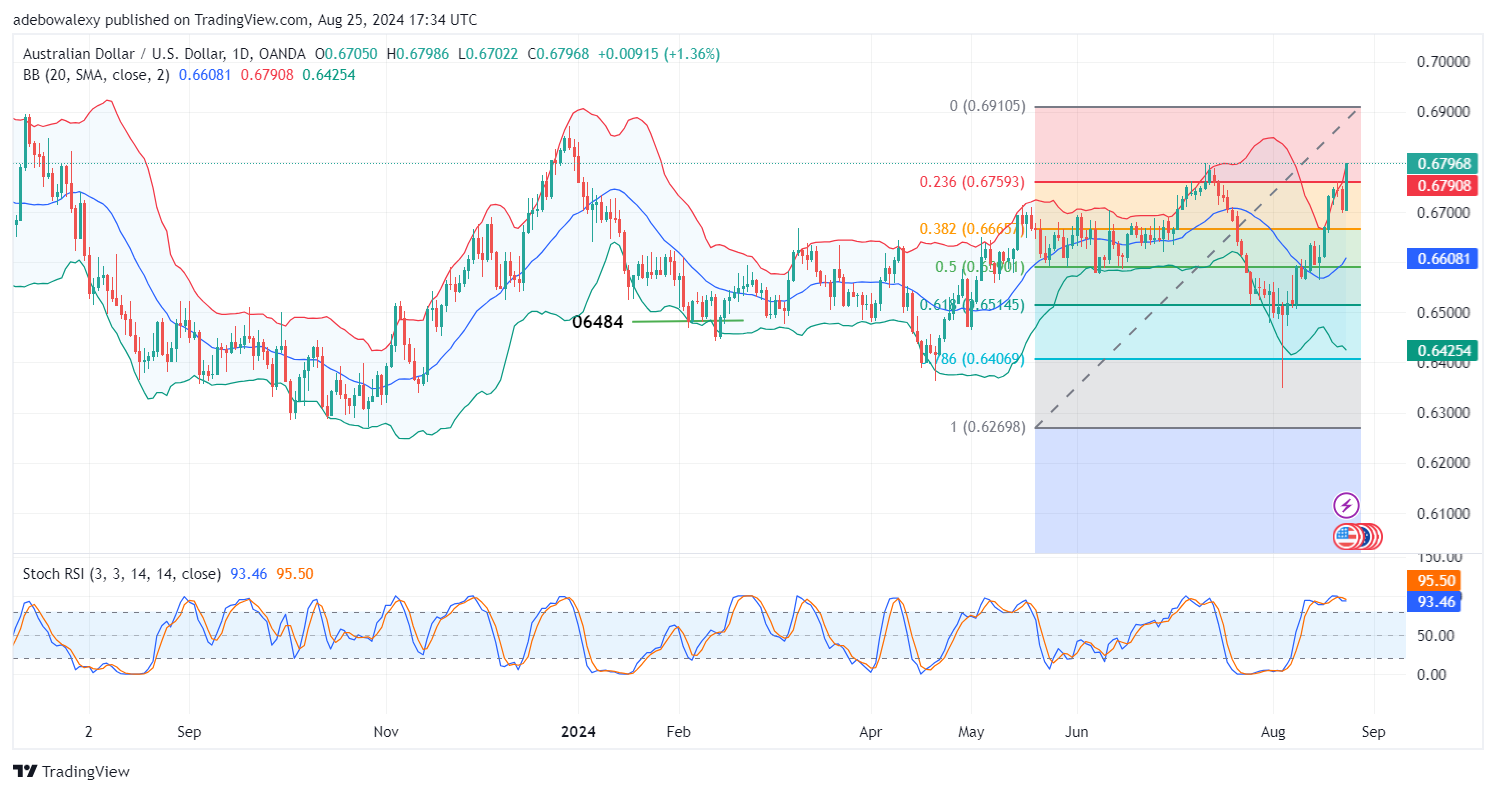
With the market eyeing the Fed’s rate cut in the coming month, the US dollar continues to show weakness. Meanwhile, the AUDUSD has capitalized on this, printing significant profits. At this point, the pair has surpassed the highs last seen in July while maintaining bullish potential.
Key Price Levels:
Resistance Levels: 0.6800, 0.6900, 0.7000 Support Levels: 0.6700, 0.6600, 0.6500

AUDUSD Market Garners a Massive Boost Off the 0.6700 Mark
Following a moderate downward retracement toward the technical support at the 0.6700 price level, the AUDUSD price leaped upward. The dollar has failed to gather demand despite the risk-aversion sentiment in the market. This seems to have emanated from dovish comments from the Fed and the upcoming rate cuts in September. Meanwhile, the Australian economy has been showing some strength, which has aided the massive gains.
The last price candle on the chart has no shadow, indicating that bulls are more dominant. The Bollinger Bands (BB) indicator has widened, suggesting high volatility. Similarly, the Stochastic Relative Strength Index (Stochastic RSI) appears to be approaching a bullish crossover while in the overbought region, hinting that prices may rise past the next technical level.

AUDUSD Set to Extend Upside Corrections Past the 0.6800 Mark
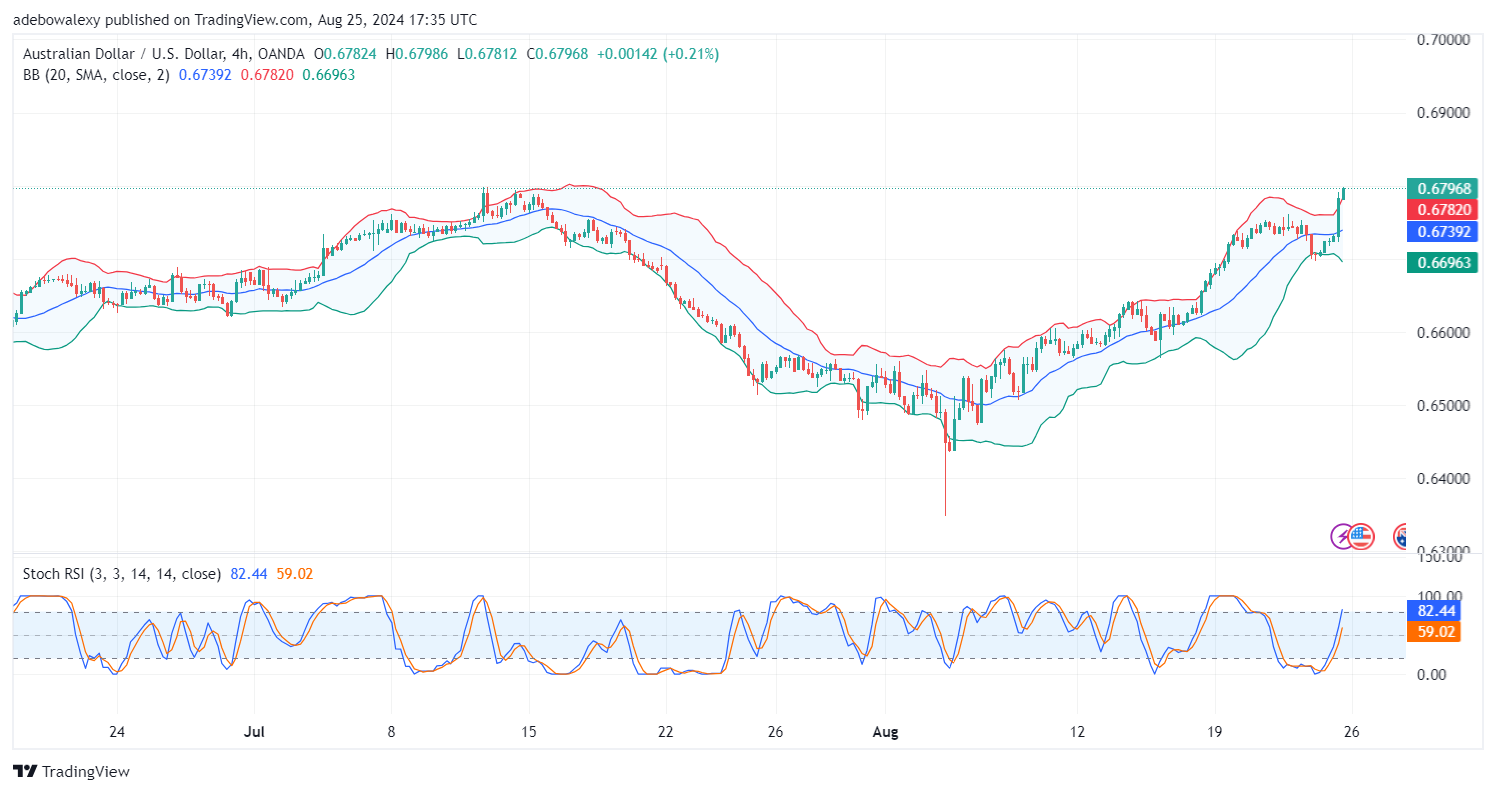
In the AUDUSD 4-hour chart, price action continues to march upward, with the current price candle protruding beyond the uppermost limit of the BB indicator. This price candle shows almost non-existent upper and lower shadows, suggesting significant upward momentum. Similarly, the Stochastic RSI lines are rising smoothly into the overbought region.
The distance between the leading and lagging lines of the indicator suggests that the market maintains healthy volatility. At this point, traders can target price levels around the 0.6840 mark, ahead of any contrary fundamentals from either side of the market.
Do you want to take your trading to the next level? Join the best platform for that here.


Leave a Reply