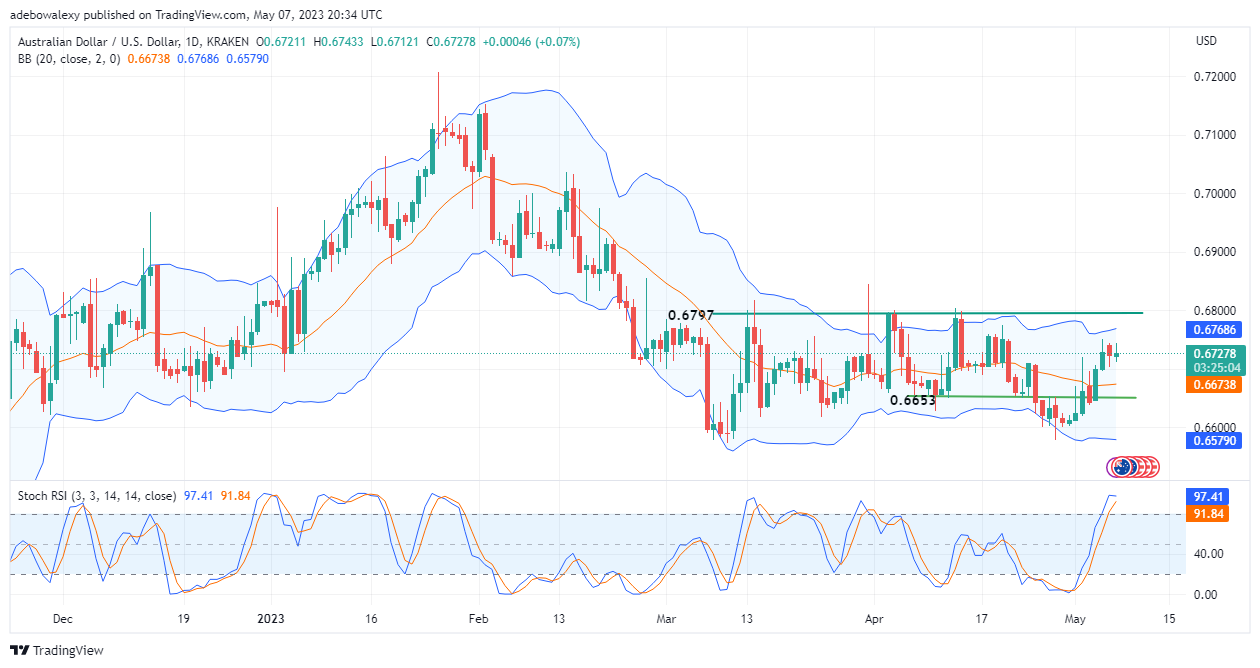
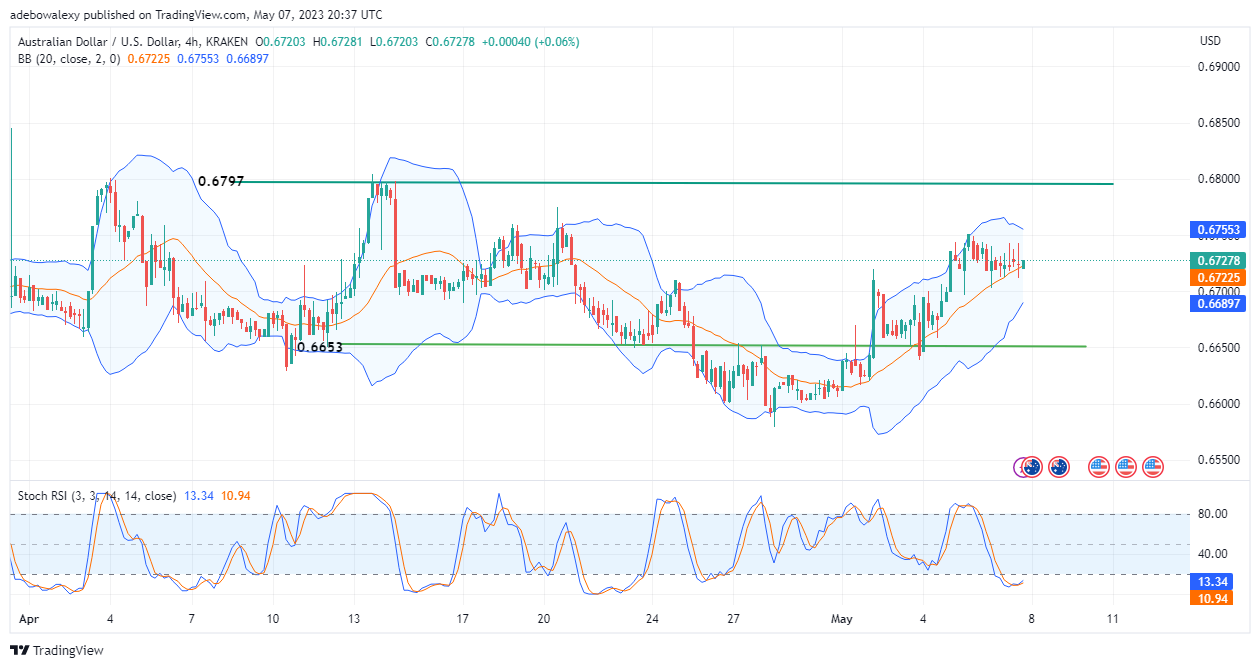
The week’s trading activity has begun with the AUDUSD pair trying to extend last weeks profits. Also, trading indicators are suggesting that upside forces may be gaining more traction as trading activities ensue.
Major Price Levels:
Resistance Levels: 0.6748, 0.6768, and 0.6797
Support Levels: 0.6720, 0.6700, and 0.6680

AUDUSD Bulls Land an Early Blow
As trading activities begin for the week, the AUDUSD pair has attracted fresh buying impulses on the daily chart. The last price candle on the daily chart signifies that price action is experiencing upside gains. At this point, price action has climbed significantly above the middle limit of the Bollinger Band. Also, the curves of the Relative Strength indicator rose into the oversold region. However, the tip of the leading line of the RSI indicator seems bent sideways at the tip. Consequently, this reflects the previous losses from the previous session. Nevertheless, the last price candle here offers hope that the price may continue upward.

AUDUSD Is Retracing upwards From an Important Base Level
On the AUDUSD 4-hour market, a green price candle that represents upside gains seems to be sitting on the middle limit of the Bollinger Band. It appears that an upside retracement has occurred off of the mentioned part of the Bollinger Bands. Meanwhile, the RSI lines are rising upwards from very deep in the oversold area. This seems to indicate that buyers have the chance to take the price towards 0.6797 as trading activities for the week continue.
Do you want to take your trading to the next level? Join the best platform for that here.


Leave a Reply