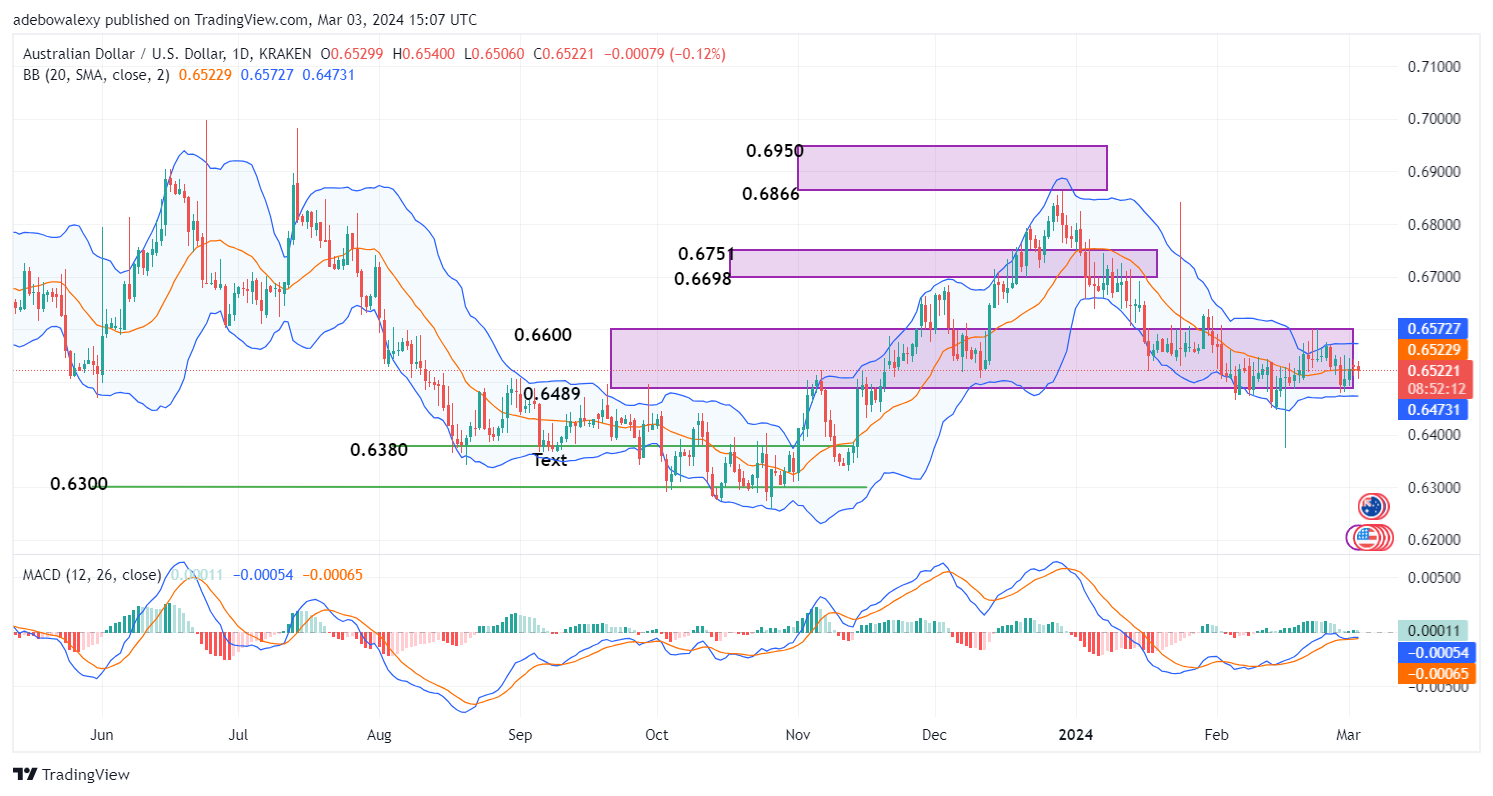
Price action in the AUDUSD market appears to be in a state of indecision. The current price of the pair aligns at the same level as technical indicators. Being above that level will indicate that price movement may continue upward, and for prices to fall below, it may indicate the possibility of a further price decline in this market. However, the market will gain a clear direction with a busy week for the USD.
Key Price Levels:
Resistance Levels: 0.6522, 0.6600, and 0.6700
Support Levels: 0.6500, 0.6400, and 0.6300

AUDUSD Seems Suspended in Midair
The AUDUSD daily market ended the previous week in a state of indecision. The last price candle on this chart has placed the pair at the same level as the mid-limit of the Bollinger Bands. This suggests that traders are in a state of dilemma at this point since the market lacks a clear direction.
Also, the Moving Average Convergence Divergence (MACD) indicator lines seem to lack much vigor at this point. The tiny MACD bar that has appeared above the equilibrium level of this indicator is pale in appearance. This suggests that the market might need a much closer study for more insight.

The AUDUSD Market May Be Preparing for an Upside Move
The AUDUSD pair on the 4-hour market seems relatively constant, with prices at the middle limit of the Bollinger Bands. Likewise, this indicates indecision in this market. The Stochastic Relative Strength Index (RSI) indicator has previously fallen very sharply into the oversold region.
Meanwhile, the leading line of this indicator is now bent towards the lagging one in what seems like an attempt for a bullish crossover. Combined with the wave of economic data that will soon emerge from the US, it seems like the best Forex signal to utilize in this market will be a bullish one, with targets near the 0.6600 mark.
Do you want to take your trading to the next level? Join the best platform for that here.


Leave a Reply