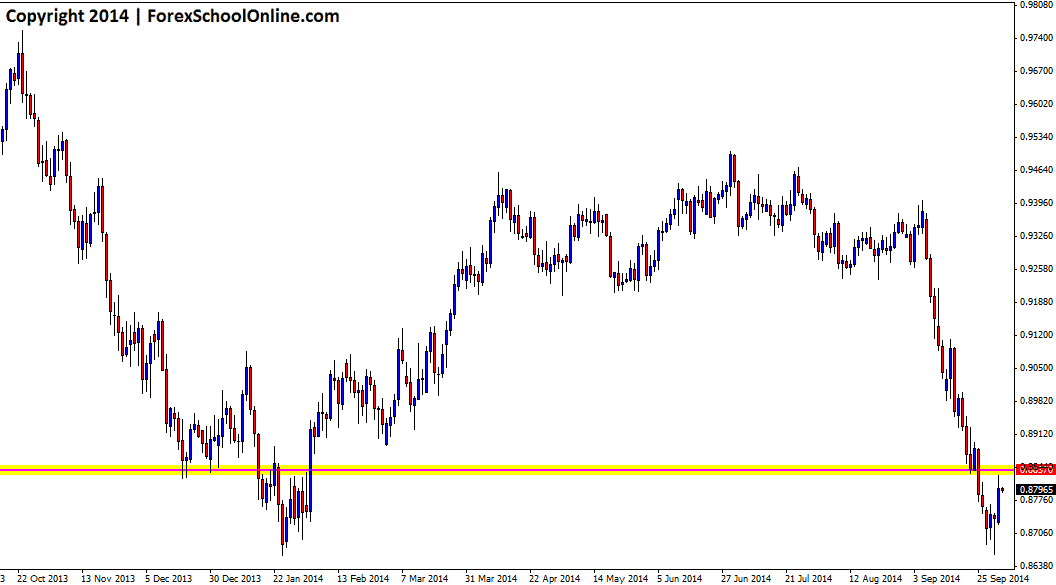
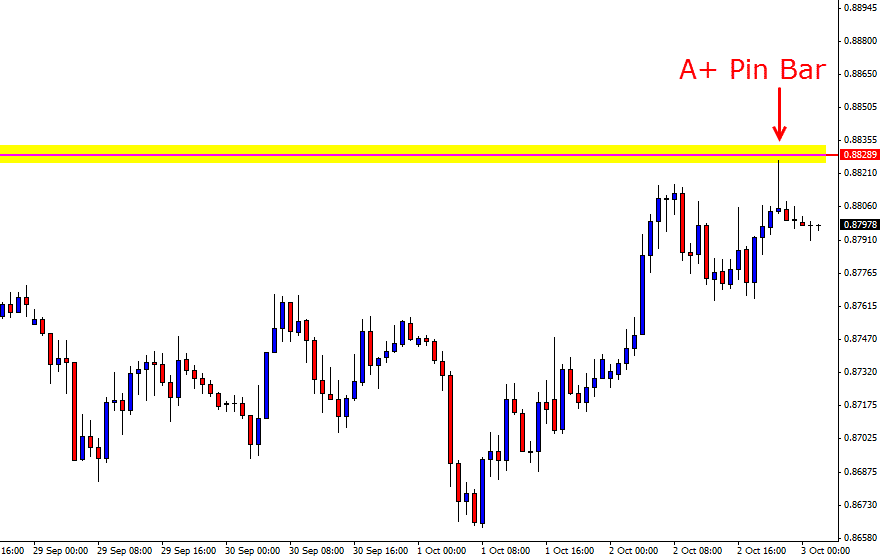
The Aussie (AUDUSD) has fired off a false break pin bar on the 1hr chart that is rejecting a key daily price flip level. This pin bar was formed during the last few hours of the US session and price is now stalled at the started of the Asian session. As the daily chart shows below, price has been smashed lower of late as I discussed earlier in the week in the 30 Sep Daily Market Commentary with price losing over 600 pips in he last three weeks alone. As I went through in that post; the best way to play these types of markets where there is a clear and obvious trend in place is to look for setups with the trend at key value points, rather than to try and fight against it.
As the 1hr chart shows below; this pin is not only rejecting the daily key resistance and price flip level, but it is also making a false break of the recent 1hr resistance level. There is a bit of traffic below the pin bar for price to get through, but if price can break lower, the near term support looks to come in around the 0.8773 level.
If price moves higher and above the pin bar high, a new short term trend could be on the cards that I discussed to watch out for in the market commentary earlier in the week on the Aussie.
AUDUSD Daily Chart

AUDUSD 1hr Chart

Related Forex Trading Education
– How to Trade False Break Pin Bar Setups * Live Price Action Video Setup*


Hiya Johno
Loved this trade on the H1. My D1 level was exactly at the 0.8800 level and I usually am put off by price closing the wrong side of my D1 levels so in this case I did wait for it to break lower, with a buffer to get me into the trade. With the trail to break even it did end up coming back to stop me out. What a nice drop though.. shame I wasnt on it! How do you deal with trades that close the opposite side of our daily S/R levels? Trades like this really need to be a part of our edge.
Thanks for posting this lovely setup!
Jason
Heya Jason,
it is very important that as price action traders we are marking our levels on the daily charts and then when moving down to the intraday charts whether it be the 8hr or 15 minute charts we are “reading” the price action and not just looking for patterns i,e pin bars or EB’s etc.
After marking our daily level and then moving to the smaller time frame we need to take note of what the price action is doing and what the price action story is saying, not simply look for a trigger. For example; we need to see if price is rejecting the key level and making a strong move away as this clearly was.
Just lastly; whilst we always want to use round number where we can, we need to make sure we mainly focus on the major VBRN and not let the minor round numbers get in our way of obvious levels. If we look at previous price action here and both where price has paused and respected in the past including the pause before continuing lower just recently there is a clear price flip level that price has both in the past and over the last week respected pretty closely.
Great post and safe trading,
Johnathon
Many trader who trade the daily charts would probably not notice the hr pin bar on the aussie – although it appeared to be rejecting the R levels, most would wait for more confirmation before taking a trade. To enter, you would have to see the pin on Oct 2 then take the trade before the start of the Oct 3 trading day. As one can see, by the close of Oct 3rd the trade was over and price went to support for daily levels
my two cents
T
Heya Tony,
Nice post. When price is in a really obvious and strong downtrend and then moves into a major price flip and resistance level, traders should be scanning all their time frames (as we often discuss and post about in here regularly). It is not so much about the time frame, but about the price action and what it is doing and the 1hr chart fired off a clear sign that price was rejecting the resistance and had also made a false break of the 1hr recent resistance. If price moved up to the key level and shown signs of moving and closing above as often happens, then obviously we move on to the next chart where price is getting close to a key daily level.
Whilst there are never any guaranteed trades no matter how great they look, this was a bread and butter setup with the major daily level and strong price action rejection.
Johnathon