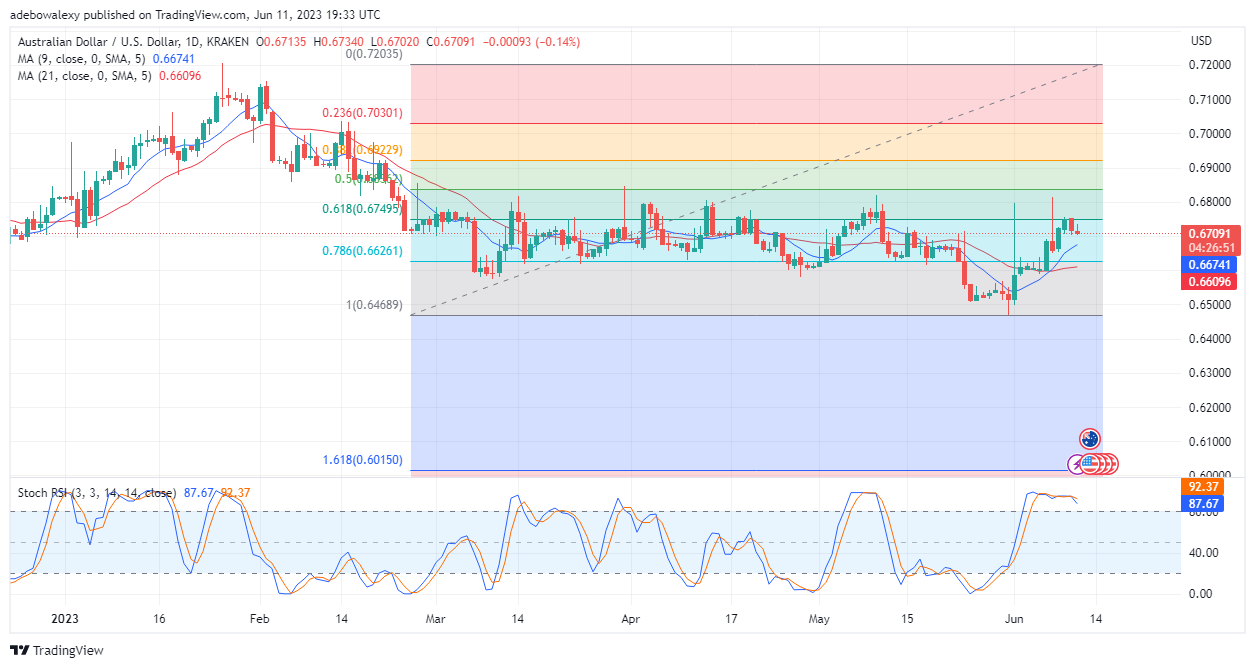
This week’s trading activities started with AUDUSD price retracing further away from the resistance price mark. Consequently, this suggests that traders may have to part with more profit as trading activities continue. However, it will be too early to conclude like that. Let’s get more insight from this market for better judgment.
Major Price Levels:
Resistance Levels: 0.6720, 0.6770, and 0.6800
Support Levels: 0.6709, 0.6680, and 0.6640

Bullish Traders in the AUDUSD May Record More Losses
The AUDUSD pair has extended last week’s losses further in the first trading session. This seems to have offered more bearishness to the market. However, trading activities are still occurring above the 9- and 21-day Moving Average (MA) lines, and this still offers some comfort to the buyer as it suggests that an upside retracement is still possible in this market. Furthermore, the Stochastic Relative Strength Index (RSI) indicator has given a clear indication that downward momentum is strengthening and may cause more downward price retracement. The lines of the RSI indicator have started trending downward after spending significant time in the overbought region.

AUDUSD Bearish Momentum Is Getting Stronger
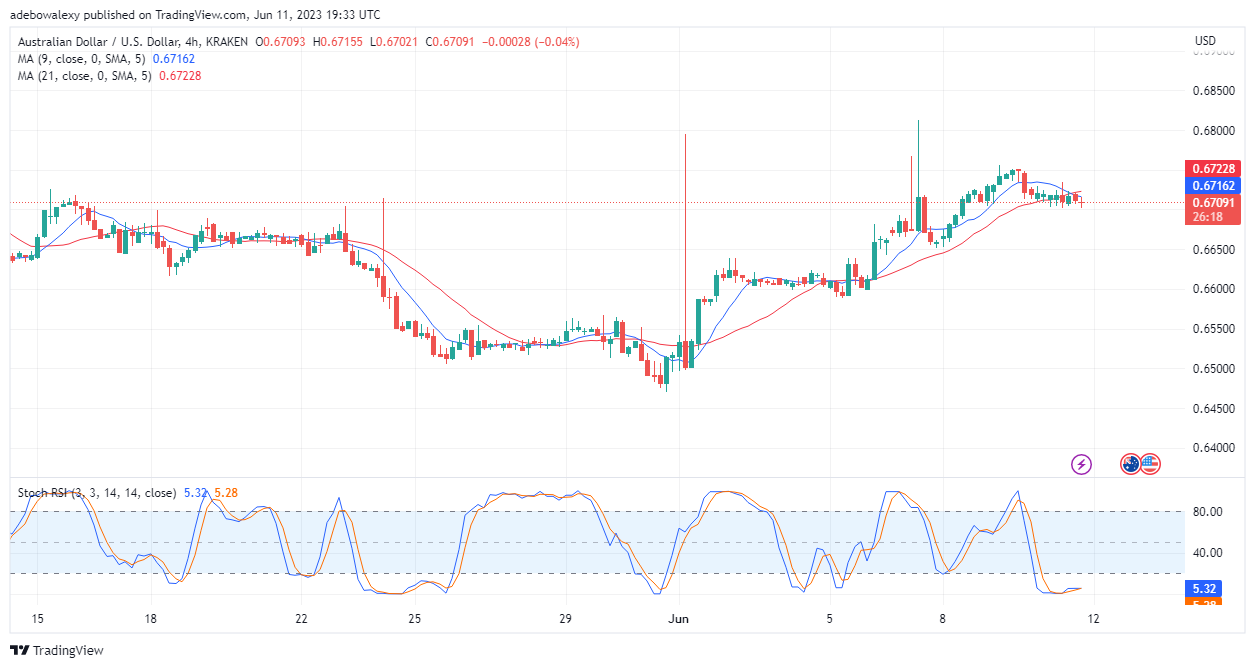
The AUDUSD 4-hour market revealed that short traders may continue recording more profits as opposed to bullish ones. This inference is drawn from the fact that a new bearish trading session has started below the crossover between the 9- and 21-day MA lines, considering the appearance of the last price candle here. Meanwhile, looking at the RSI indicator lines, it could be seen that the lines of this indicator are in the oversold region yet have come together for a bullish crossover. Consequently, this suggests that the pair price may venture below the 0.6700 threshold, into the 0.6680 mark.
Do you want to take your trading to the next level? Join the best platform for that here.


Leave a Reply