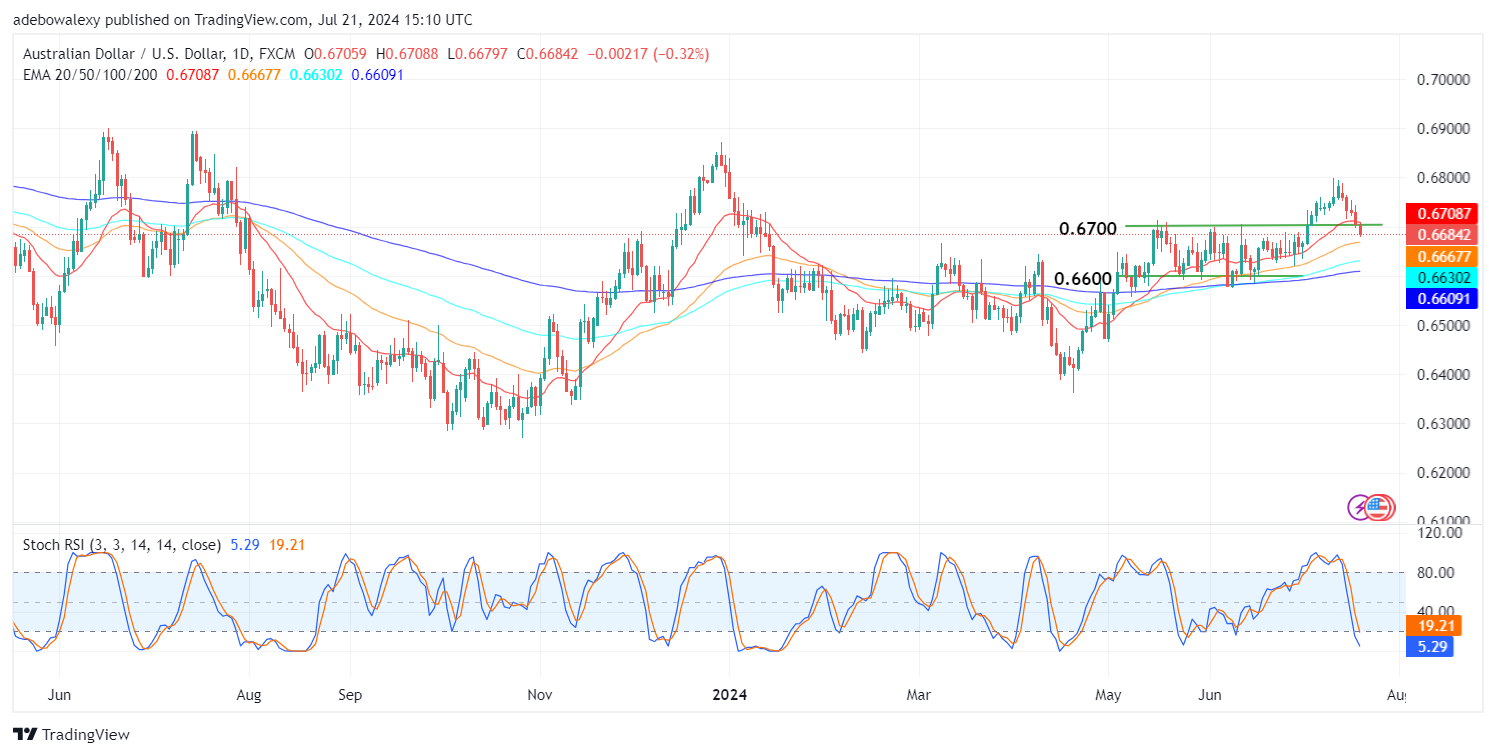
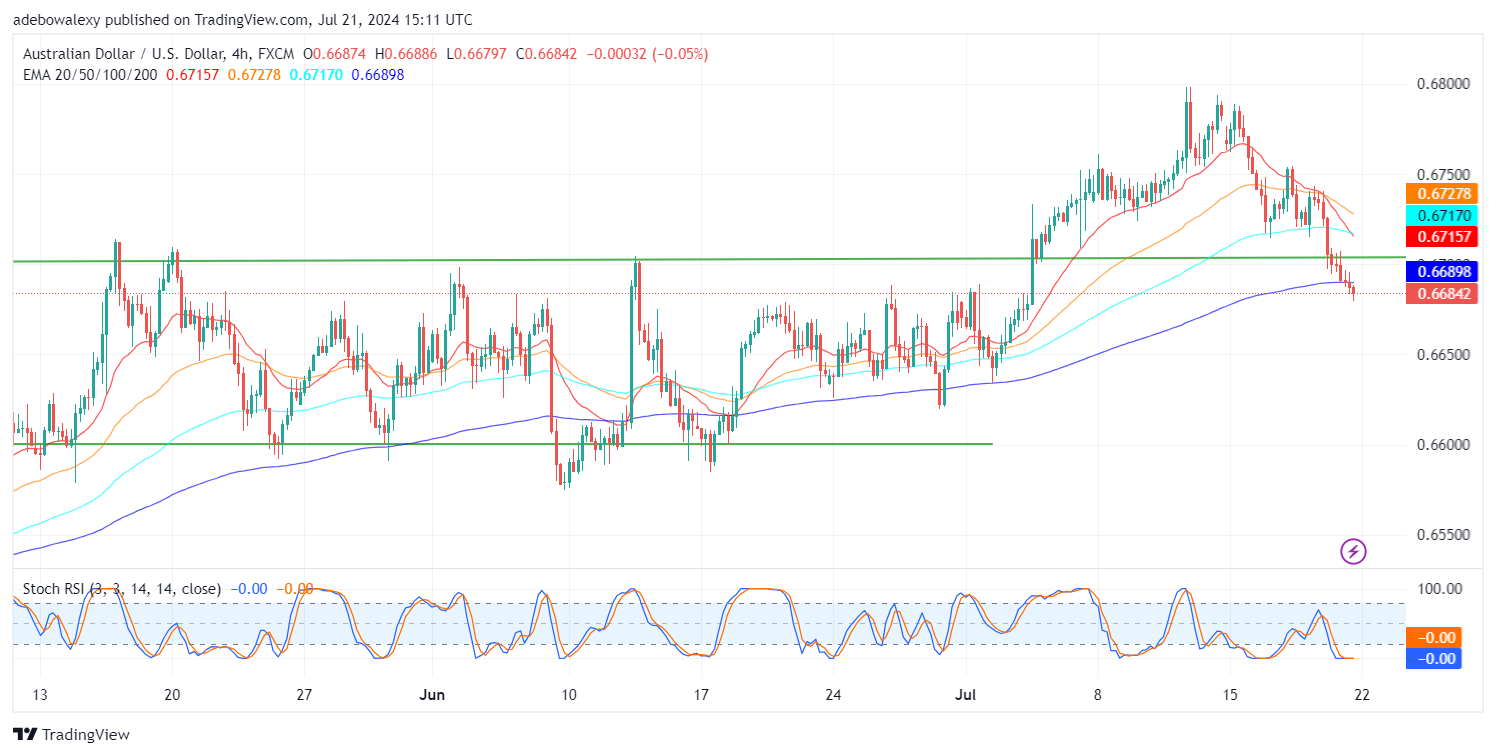
The US dollar seems to have picked up some strength ahead of a new week loaded with fundamentals that may have a positive impact. This has caused the AUDUSD pair to fall towards lower price levels, breaking a support level over one week old at the 0.6700 price level. Let’s see how the market develops as the week unfolds.
Key Price Levels:
Resistance Levels: 0.6700, 0.6800, and 0.6900
Support Levels: 0.6600, 0.6500, and 0.6400

AUDUSD Makes a U-turn off the 0.6800 Resistance
The AUDUSD pair terminates its upside correction through the 0.6700 mark as soon as its price action tested the resistance at the 0.6800 mark. Currently, the pair trades below the 20-day Exponential Moving Average (EMA) curve.
Likewise, the Stochastic Relative Strength Index (SRSI) lines can be seen deep in the overbought region. Also, the last price candle on the chart seems like a moderately sized price candle, and as such, it points out that downward forces may still retain significant control of price movement.

AUDUSD Bears Seem to Be Gaining More Ground
With the RBA maintaining a steady interest rate against a more dynamic USD side, the AUDUSD market seems to have more bearish prospects. Here, price activity has fallen below all the EMA lines on the chart. Also, the 50- and 100-day EMA lines can be seen converging above price activity.
Likewise, the SRSI lines can already be seen flat out in the oversold region. Consequently the lines of the indicator are merged and are now trending sideways at the 0.00 level. Therefore, it seems headwinds are too strong at this point, and the market may continue towards the 0.6650 mark in the week.
Do you want to take your trading to the next level? Join the best platform for that here.


Leave a Reply