The AUDUSD has burst lower on the daily price action chart and has now broken through the most recent swing point. Price had found support and bounced higher for three days, but price has since crashed lower and back through support. This new bearish momentum was kicked off from a large bearish engulfing bar (BEEB) that was up at the high and rejecting resistance and since this BEEB has had it’s low broken, price has sold off aggressively. The BEEB that kicked this move lower was covered live in this blog and you can read the original post HERE.
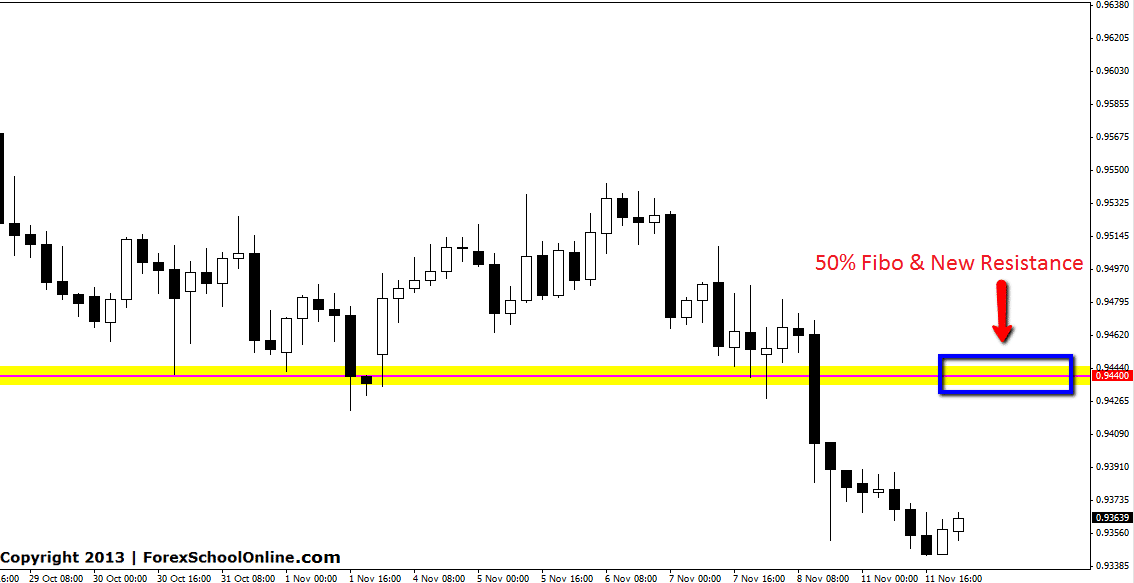
Now price has broken through the most recent support level, it could act as a price flip area and now turn to a new resistance. Should price move back higher and into this old support area, it could now act as a new resistance and traders could not target this level for short trades.
Trades would have to be targeted on intraday charts because the daily charts would not have a enough space to make a short trade. If price on the daily chart was to move back into this resistance, price would not be at a swing high and any bearish price action would not be valid to trade. The 4hr chart below shows how whilst trading from this same level still ensures traders are still making a trade from a solid level, but because the trade is on an intraday chart there is far more space to make the trade on. It would also ensure that the bearish price action is from a swing high and not from the low like the daily chart would be. In my recent video I discuss this at length and how this works and how trading from an intraday chart gives trades more space. You can watch the video HERE.
AUDUSD Daily Chart

AUDUSD 4hr Chart


Leave a Reply