In the previous week, the AUDUSD price had ramped up significantly due to some favorable fundamentals. However, this upside move seems to have hit a significant amount of take profit, and this has introduced a significant downward retracement of prices. Let’s study how things may proceed in this market shortly.
Major Price Levels:
Resistance Levels: 0.6880, 0.6920, and 0.6960
Support Levels: 0.6851, 0.6800, and 0.6750

AUDUSD Heads Towards the 0.6820 Mark for Support
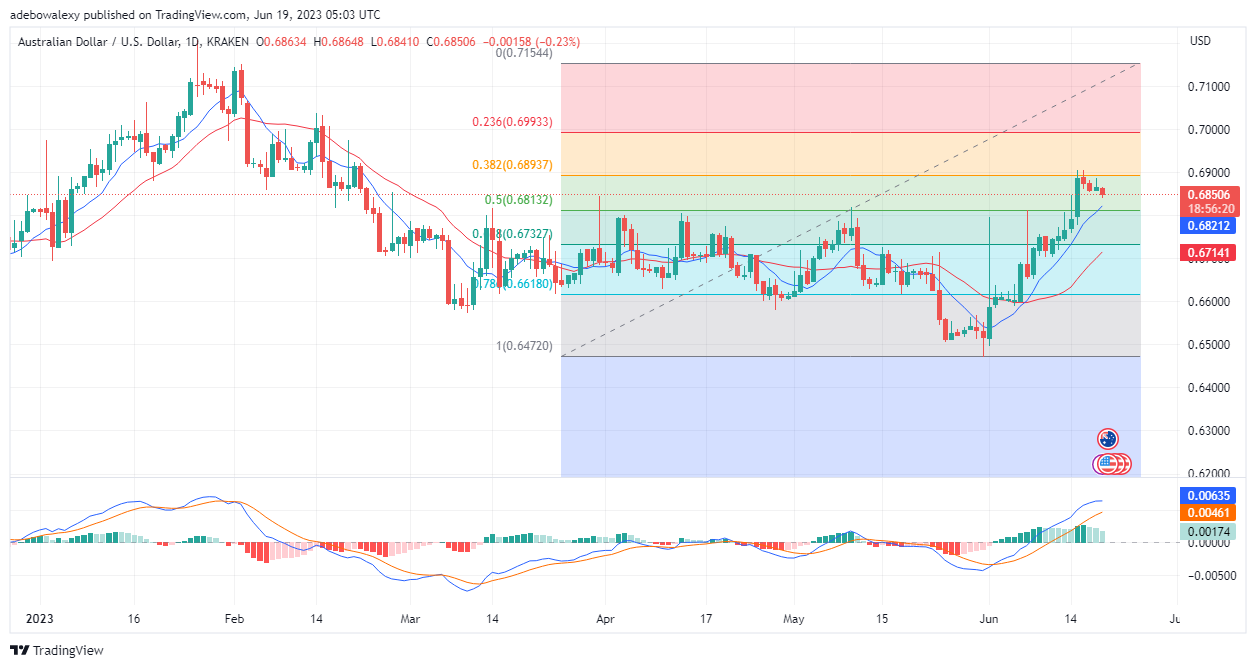
Price movements in the AUDUSD daily market tested the 0.6900 mark about four trading sessions ago. However, this resulted in a downward correction in price movement. At this point, prices seem to be heading towards the 9-day Moving Average (MA) curve since they are above both the 9- and 21-day MA lines. Meanwhile, the lines of the Moving Average Convergence Divergence indicator are still above the equilibrium point at the 0.00635 mark and 0.00461, and are far apart from each other at this point. Considering the MACD, it’s still a bit unclear if this current price movement may cross below the 9-day MA line for a more bearish move.

AUDUSD Buyers Are Trying to Resist Further Downward Retracements
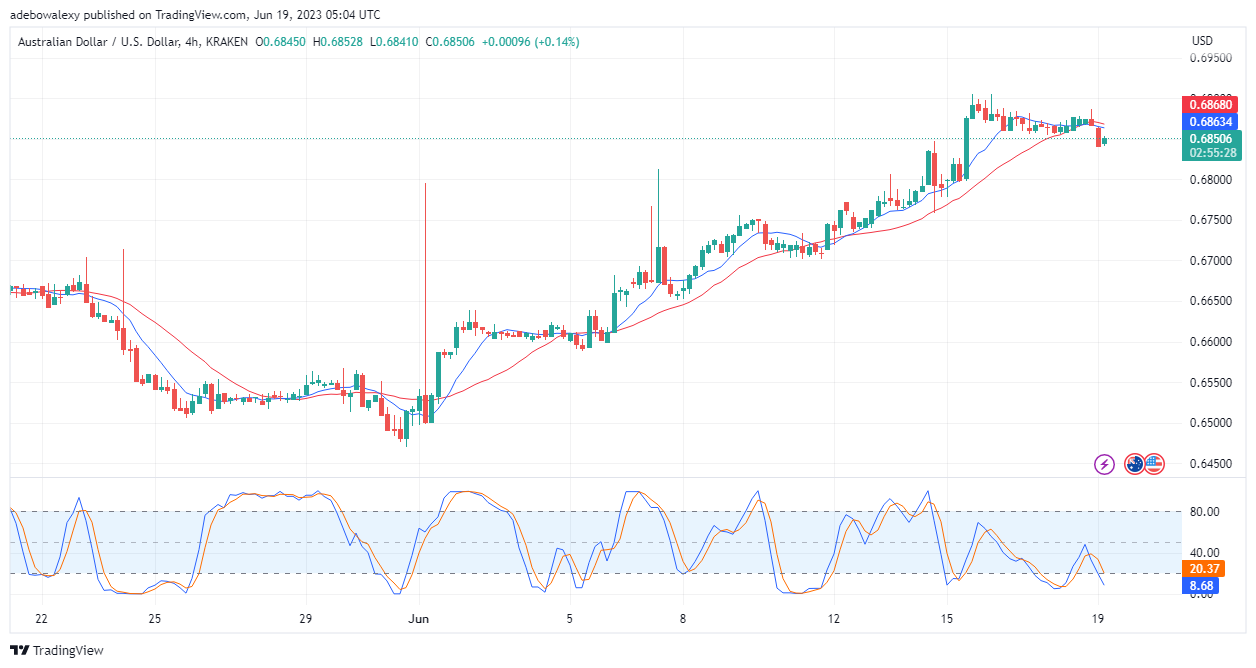
In the 4-hour market, it looks like some long traders are presenting some form of resistance to the ongoing price move. A green price candle can be seen as the last price candle on this chart. Nevertheless, traders should keep in mind that the current price level of this pair now lies below the 9- and 21-day MA curves. Also, the Stochastic RSI indicator lines are now falling into the oversold zone of the indicator. Consequently, this suggests that price action may fall lower at this point. However, the RSI curves appear a bit too sensitive. And this suggests that prices may only retrace close to 0.6800.
Do you want to take your trading to the next level? Join the best platform for that here.


Leave a Reply