Three trading sessions ago, price action in the AUDUSD market took a long leg down after testing the 0.6780 price mark. This caused prices to sharply retrace the 0.6706 price mark. However, it appears that buyers are making moves to change the market tone at this point.
Major Price Levels:
Top Levels: 0.6718, 0.6750, and 0.6780
Floor Levels: 0.6700, 0.6680, and 0.6660

AUDUSD Buyers Are Now Positioned to Drive Market Price Upward
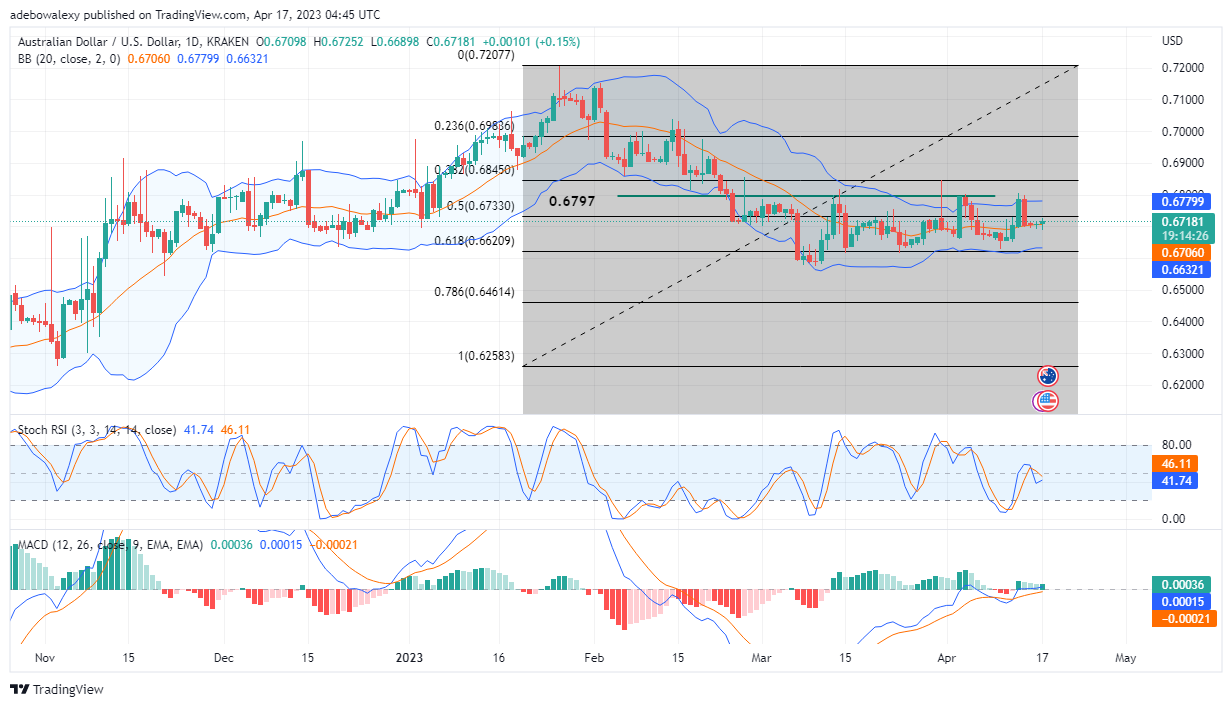
On the AUDUSD daily chart, the last price candle on this chart is sitting on the middle band of the Bollinger Bands indicator. Consequently, this suggests that the current price level of the pair is above the aforementioned point. Simultaneously, a bullish crossover seems to be underway on the Stochastic Relative Strength Index (RSI) indicator. The lines of this indicator can be seen approaching each other above the 40 mark of the indicator. A crossover may result in a much quicker price upside recovery. Meanwhile, the leading line of the Moving Average Convergence and Divergence (MACD) has just crossed the 0.00 line. Also, a green bar has just appeared on the MACD, and this suggests that buyers may keep pushing the price upward.

Trading Indicators Continue to Predict a Better Outlook for AUDUSD
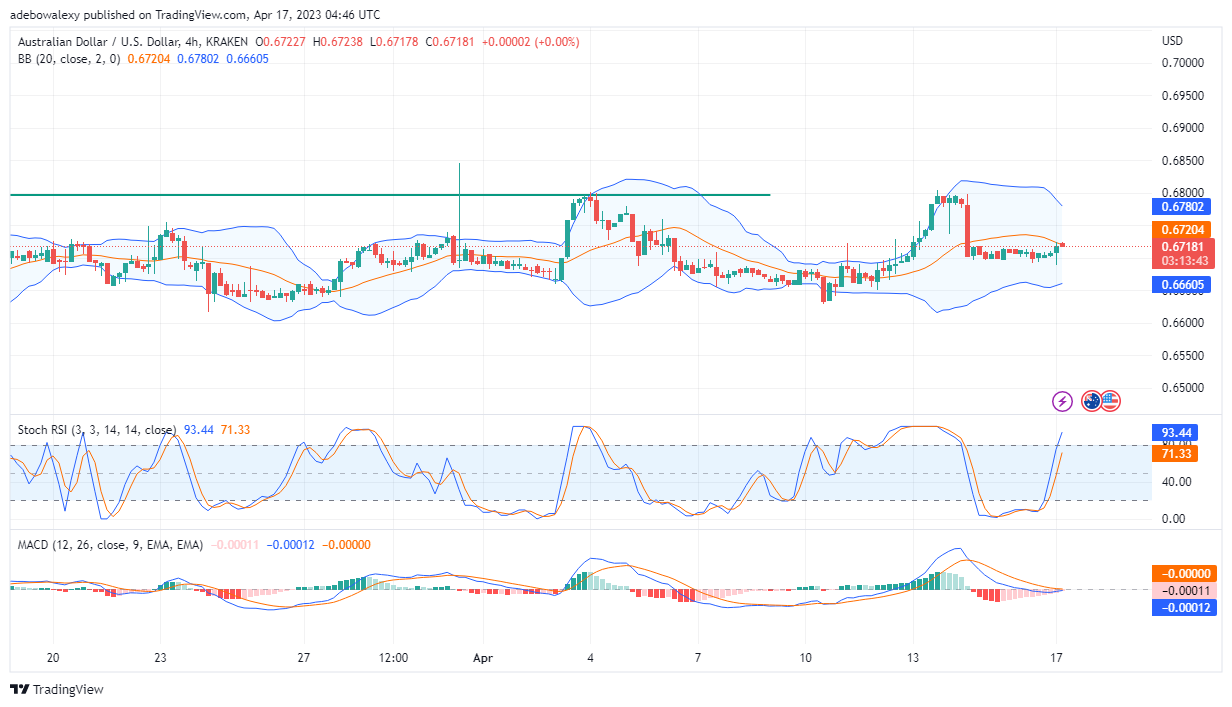
Although the last price candle on the 4-hour AUDUSD market is a bearish one, trading indicators are maintaining their bullish stance about this market. The lines of the Stochastic RSI rise sharply into the overbought region. Meanwhile, the MACD lines are also nearing a bullish crossover at the equilibrium level. Additionally, the bars of this indicator are still pale red to indicate a decrease in downward forces. However, traders should pay attention to the RSI, as it seems too sensitive. Nevertheless, an additional price increase is still possible towards the 0.6750 mark.
Do you want to take your trading to the next level? Join the best platform for that here.


Leave a Reply