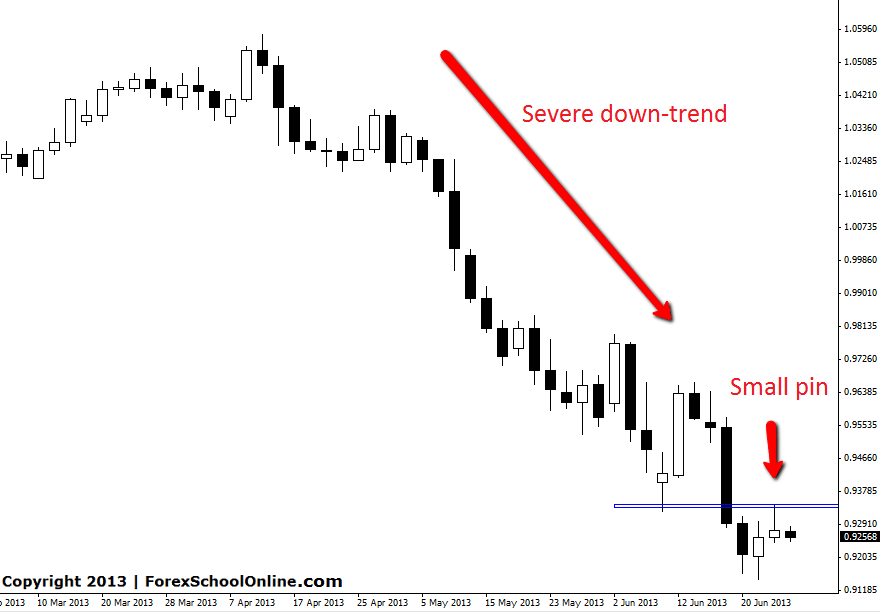
Price on the AUDUSD 2 day chart has moved higher to test a key resistance level before being rejected and closing lower forming a small Pin Bar reversal. This Pin Bar is small, however it is formed in-line with the most recent very strong down-trend and also rejecting a key daily resistance level.
Price has been trending down lower on this pair for the past three months with price making lower lows and lower highs. This trend has been pretty extreme with the fall in price being severe. Trading against this trend has been short lived as any attempts to go long have only ended with price rolling over and price continuing with the trend and until we see signs this trend is over the best play are to continue trading with the dominant trend.
If the price can break the Pin Bar and move lower the near term support comes in around the recent lows. It is here that price will have it’s first test of support. If price fails and moves higher it is then that we can start watching for signs of a possible new short term trend on the horizon.
If you are trading with MT4 platform and wondering how we change our charts to make any time frame we like such as the 2 day AUDUSD you see below or you want to get the correct charts please see HERE.
AUDUSD 2 DAY CHART | 28 JUNE 2013

I have recently released a new article that is helping traders transform their trading. If you have not read it yet make sure you go over and spend a couple of minutes reading it here: Transform Your Trading With a Profitable Edge
If you have any questions you can contact me HERE.


Leave a Reply