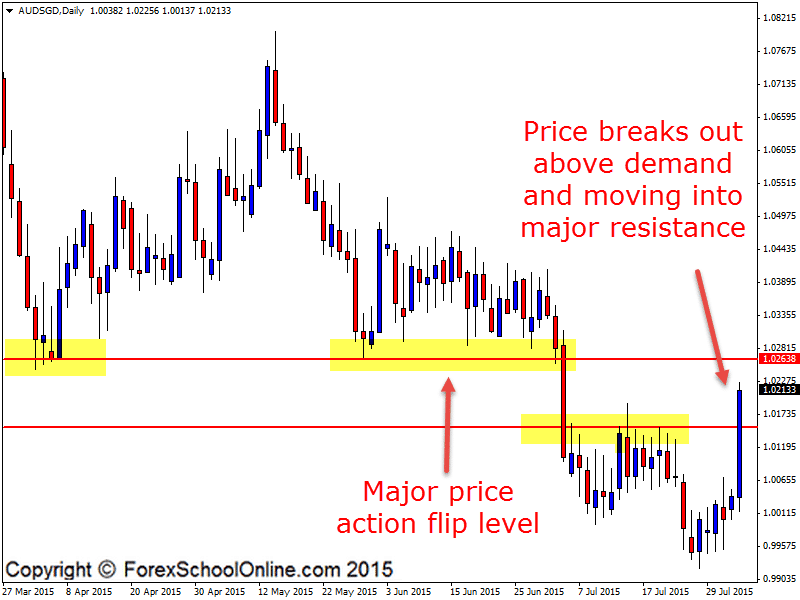
The AUDSGD has made a huge break, higher and out of the major daily demand area, that it has been stuck in for the last month. With this strong move, higher price has aggressively pushed through the daily resistance that in recent weeks, only candle highs have been able to test. It is now interesting to watch the price action behavior on this chart, and in particular, where it closes on the daily chart.
Where price can and cannot close or does or does not close is absolutely critical information, and when you learn to read it correctly in the context of the overall price action story, it can tell you a heck of a lot about what is going on behind the price action order flow. Price will need to close out and above this level for this resistance to break and for price to look to flip to a new support level.
I talk about price flip levels, just how important they are, and how you can use them to hunt really high probability price action trades in your trading in the lesson below:
Hunt Forex Trade Like a Sniper Hiding in the Bushes
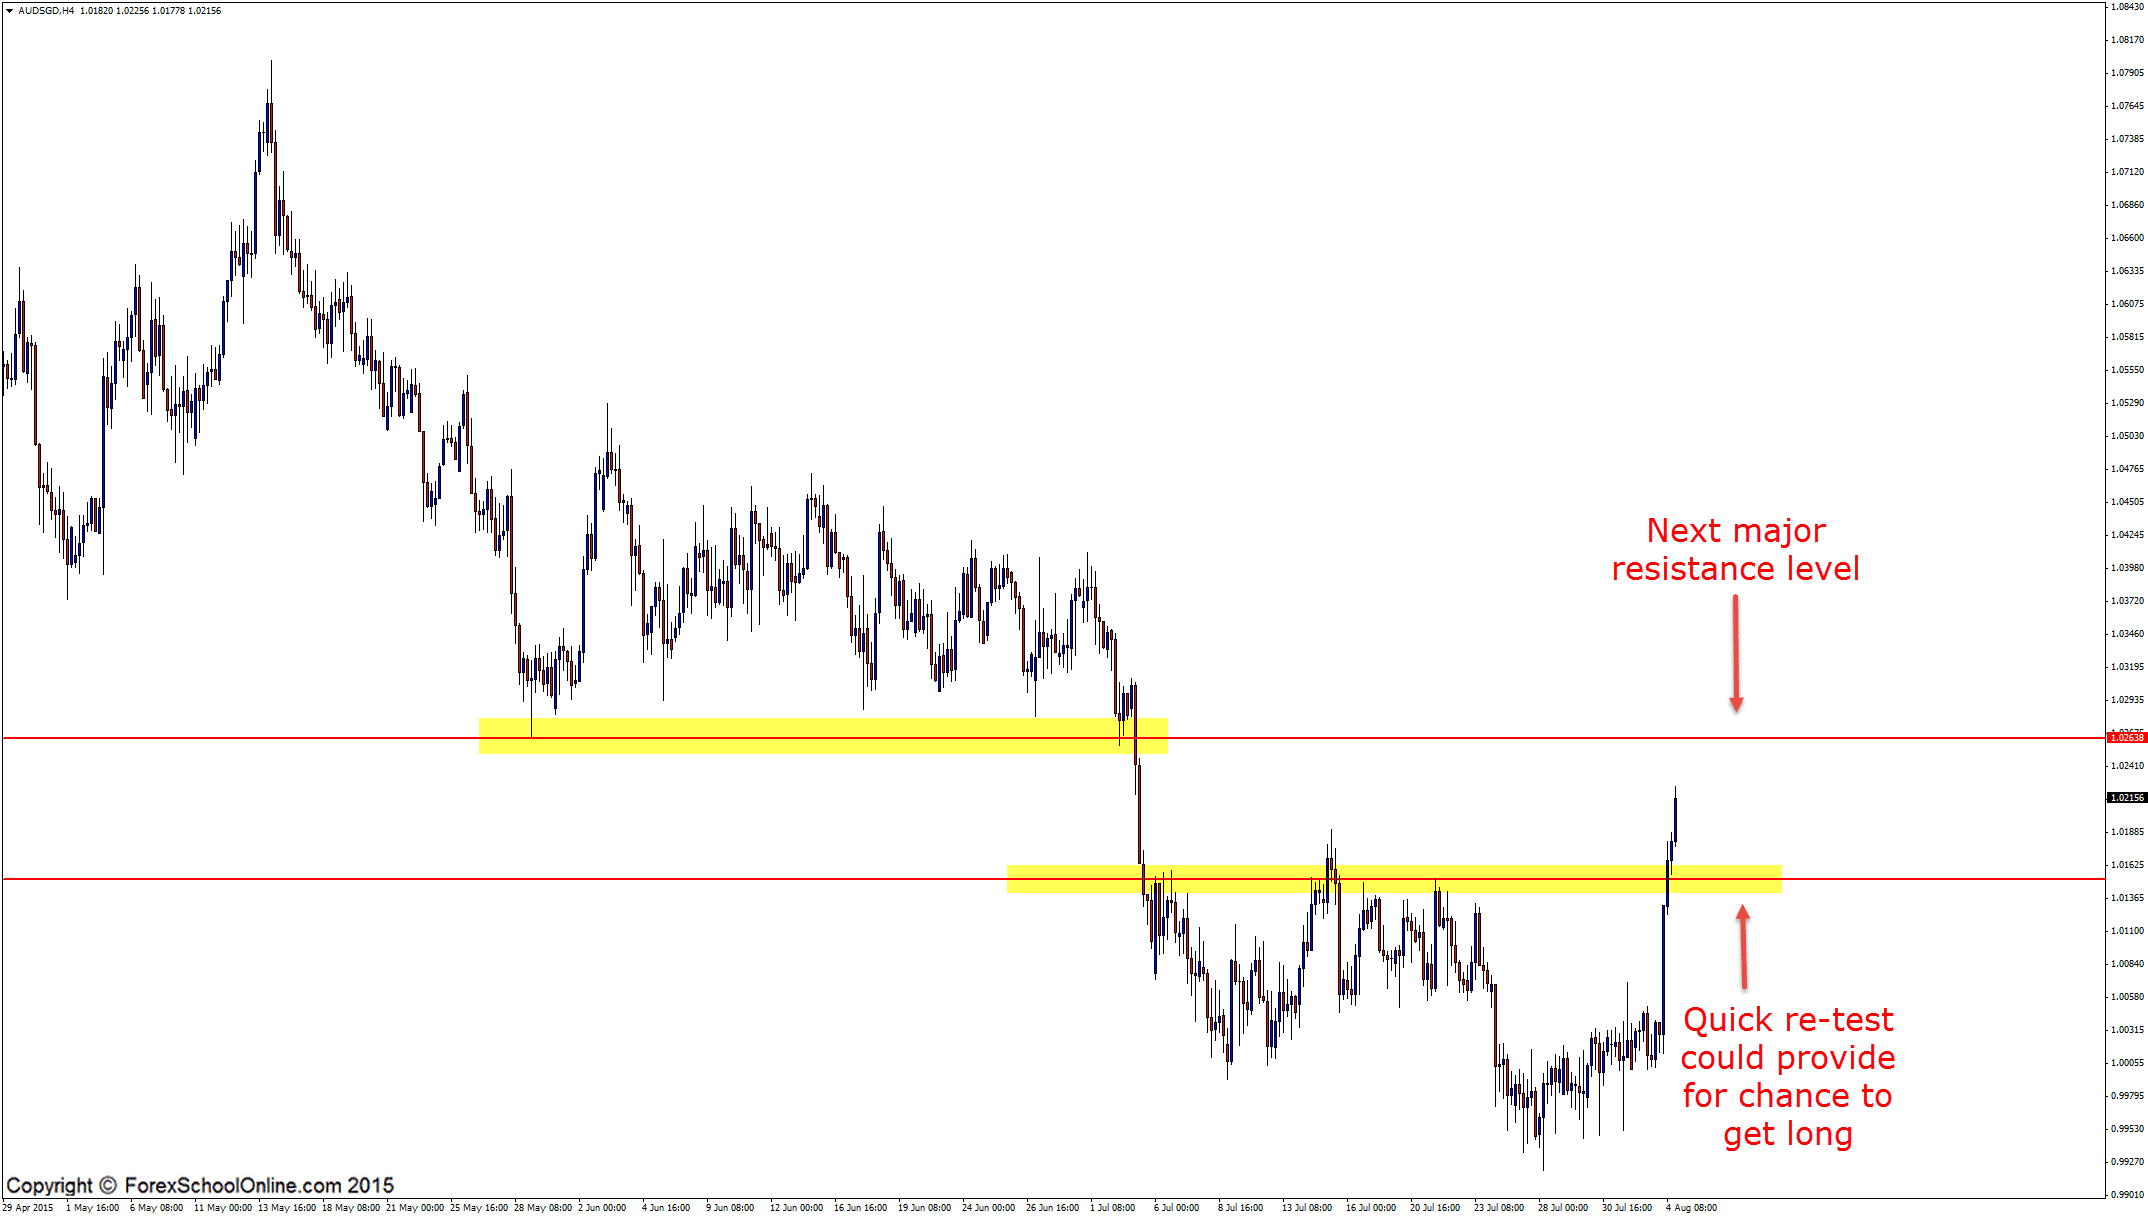
Now that price is above this important daily level, you can begin to watch the price action to look for potential trade opportunities. If price makes a quick retrace back into the old resistance and new support level just like I have highlighted on the 4 hour price action chart below, you could look for long trades, should any really high probability bullish price action fire off like the ones I teach my students in the Lifetime Membership Price Action Course.
The other potential trade setup in this market is if price continues the strong move higher and into the resistance overhead. If this happens, you could then look to see if price rejects this level with any strong bearish reversal trigger signals. You could look to get into both of these potential trade opportunities on either the daily chart or lower time frame, such as the 8 hour, 4 hour, or even lower if you are comfortable on smaller time frames.
Daily Chart

4 Hour Chart


Leave a Reply