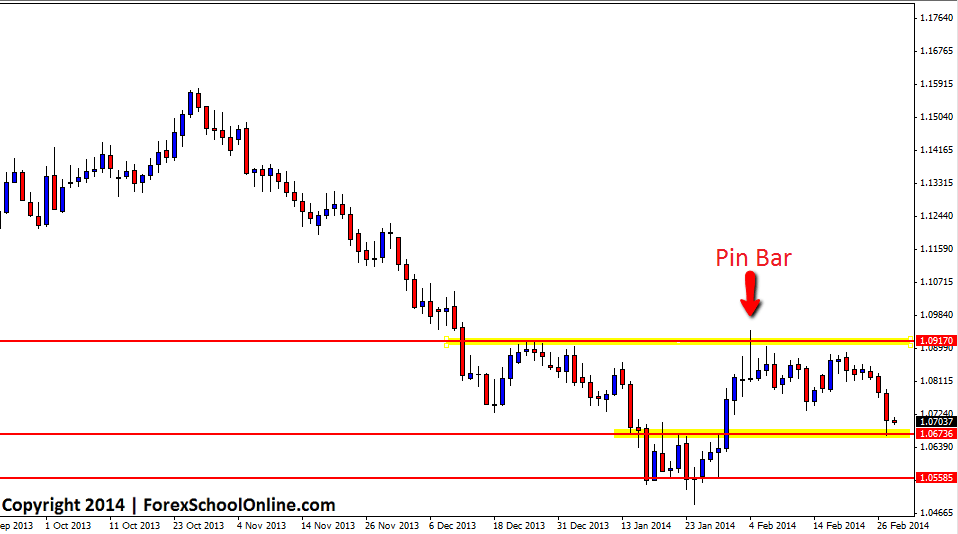
AUDNZD Daily Pin Bar Falls Lower
The AUDNZD Pin Bar that formed on the daily chart that we previously discussed in this blog as it formed live, has now finally worked out and moved lower past the first near term support and into the next key support level. To read the original post made as this pin formed read here: Pin Bar Formed on Daily Chart of AUDNZD Rejecting Key Resistance Level. This move lower has now given traders who played this pin bar a chance to take profit or at the minimum protect their capital by moving their stops to a break even position. Price has been trading sideways and has taken over two weeks to break the first near term support level to make it into the next support. This has been a great test for traders who entered this setup to stick to their plan and have faith in their method to just let price do it’s thing. From here; price has now hit support, but if it can break through and move lower, the next major support comes in around the lows at 1.0560.
AUDNZD Daily Chart

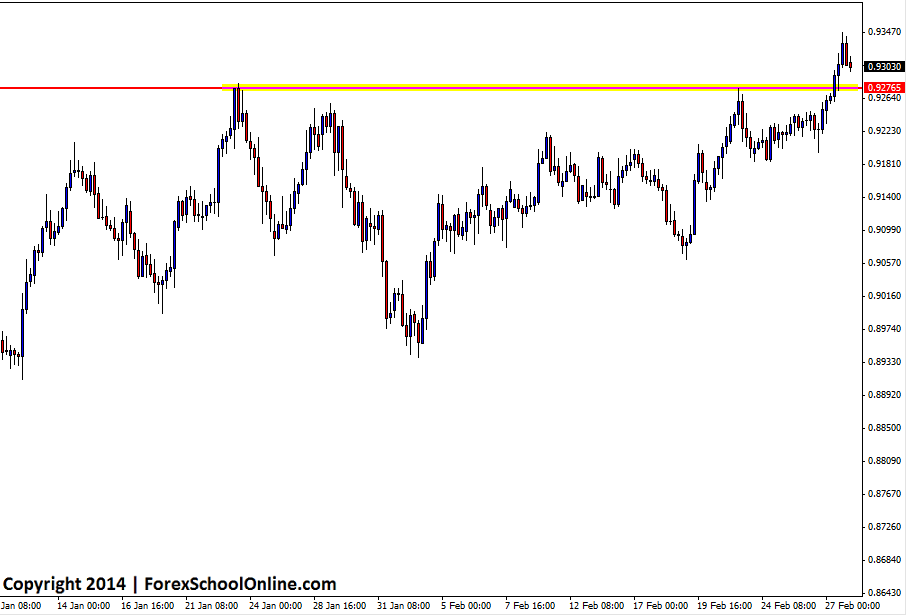
NZDCAD Setting Up For Kill Zone
The NZDCAD has broken out higher on the daily chart of a key resistance zone and most importantly closed above. In the trade lesson which you can read here: The Lessons Traders Can Learn From Price Action I discuss how traders can learn and read certain information from candlesticks including where price can and cannot close. Price closing above this resistance could be a solid sign that price has now broken out and looking for fresh long trades in this market could be the best play if price stays above this level.
On the 4hr chart this same key daily breakout area could now act as an old resistance and new support area. I have placed the 4hr chart below. The 4hr chart has formed a bearish 2 bar reversal which could be hinting at sending price lower and back into this new support area. If price moves lower and back into this new support level it could act as a solid area to look for long trades. For any potential long trades to happen traders would need to see high probability price action present such as the price action trigger signals taught in the Forex School Online Price Action Course. Obviously if price cuts straight back through this area without any solid bullish price action, then this level would then flip and look to hold as resistance.
NZDCAD 4hr Chart


Leave a Reply