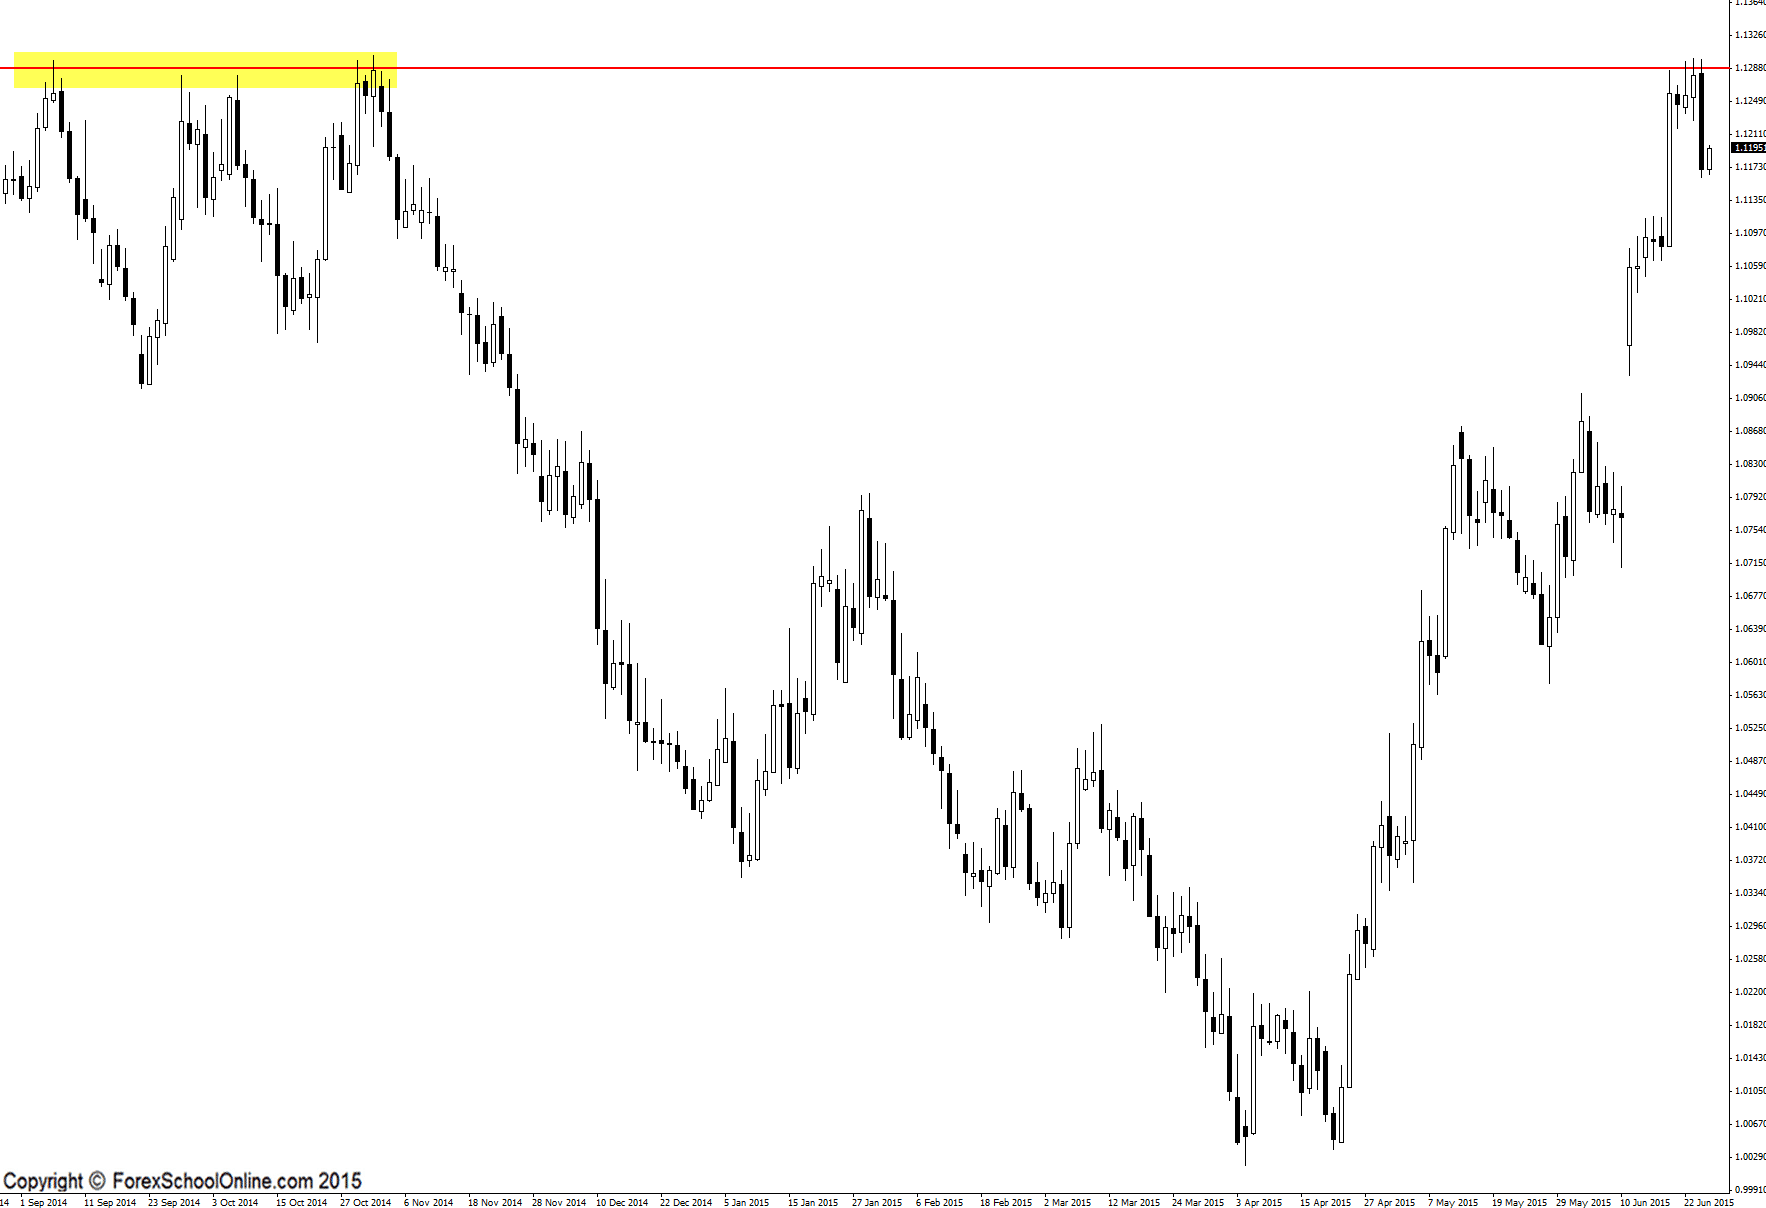
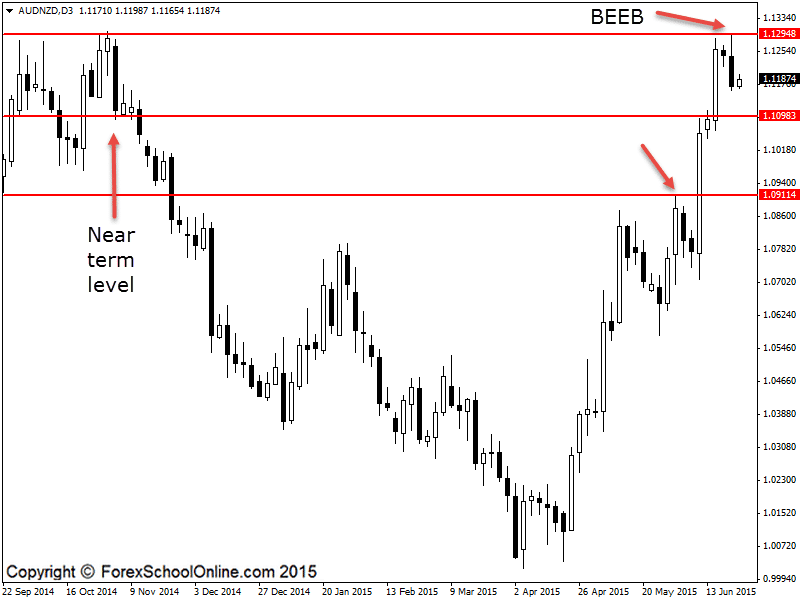
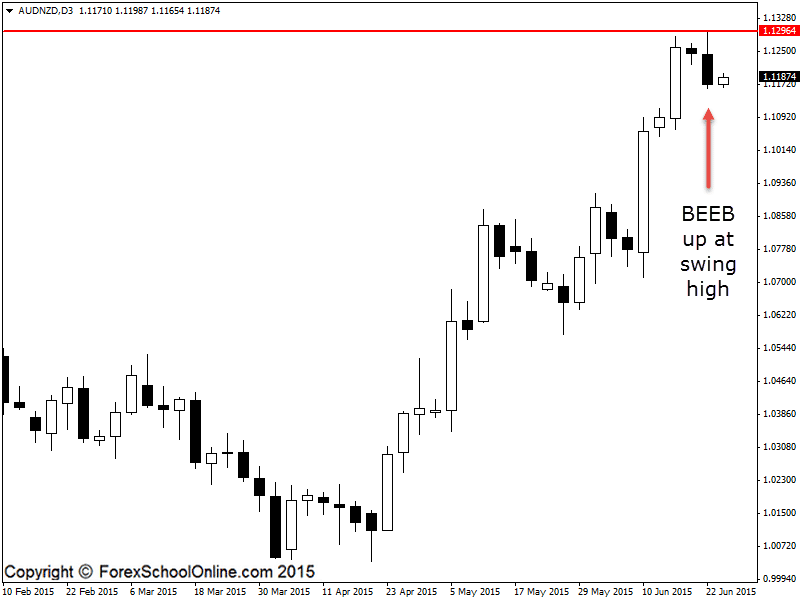
The AUDNZD has fired off a Bearish Engulfing Bar (BEEB) on the 3 day price action chart rejecting a major daily resistance level. If we look at the daily chart that I have attached for you below; we can see that price is making a strong rejection of the resistance level and that the last daily candle has closed stronger lower towards the session lows.
I only ever use the multiple time frames such as the 2 day/8 hour/6 hour/2 hour etc, if I think I can see a potential trigger signal and price is already at one of my ‘hot zones’. I do not have all of these extra multiple time frames set up all of the time and then go through them every time they close because this would be super inefficient.
As I talk about in The Ultimate Guide to Support and Resistance the best way to do this is by marking up your key daily ‘hot zones’ and then when price moves into your major support or resistance levels that you want to make a trade at, you then start to look for a trigger signal such as an engulfing bar or pin bar.
This is the time you can then look at your extra time frames such as the 2 day, 8 hour, 6 hour etc to see what the price action is doing at the major hot zone.
If the AUDNZD can now break and confirm the 3 day BEEB it could potentially break lower and into the near term support level which would come in around the 1.1090.
If you want to learn how to change any time frame to make it anything you want in your MT4 chart, then read here; Change MT4 Time Frame EA Indicator
Daily AUDNZD Chart

3 Day AUDNZD Chart

3 Day AUDNZD Chart


Leave a Reply