AUDJPY shows a bearish flag, suggesting a sell signal.
Sell traders may take their position as desired.
AUDJPY Weekly Price Analysis – September 15
AUDJPY shows a bearish flag as it currently trades in a strong bearish market. The Yen might likely drop further if the bears could add more strength to their potential selling and the market price remains low below the $90.00 support mark. The downward correction could slide further to hit the $85.00 lower support value and beyond, suggesting a sell signal for the short-term traders.
AUDJPY Market
Key Levels:
Resistance levels: $101.00, $102.00 $103.00
Support levels: $94.00, $93.00, $92.000
AUDJPY Long-term Trend: Bearish (Daily Chart)
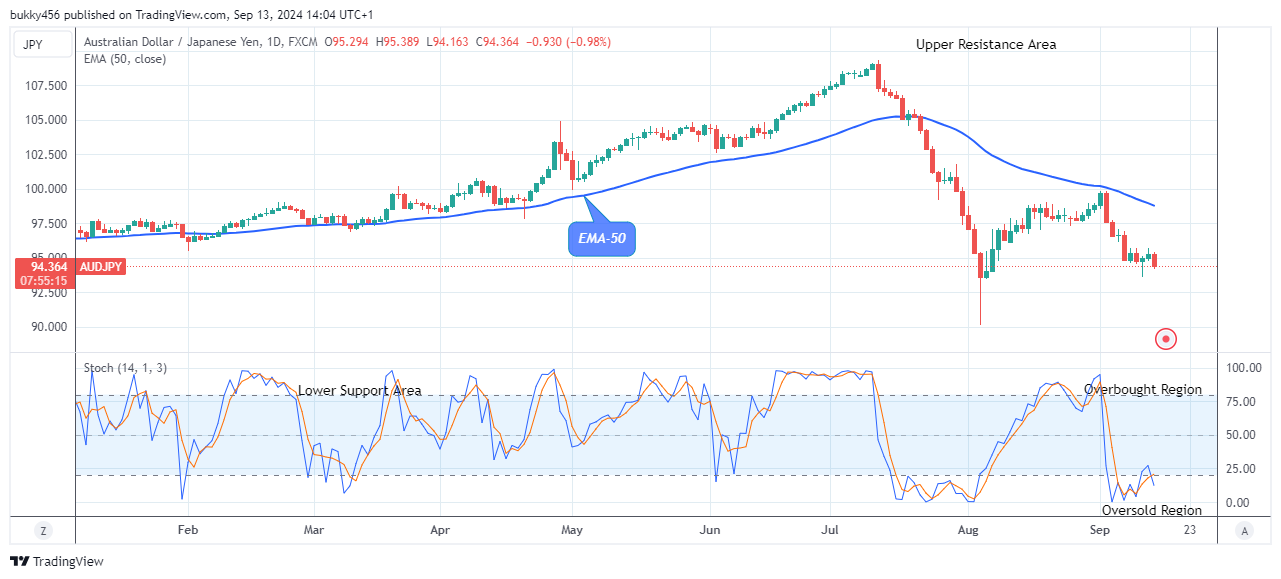
AUDJPY pair shows a bearish flag as it remains negative and continues to drop down to the lower support area in the higher time frame. The price is below the moving average line, suggesting a bearish trend and signifies a sell signal. 
In the previous actions, the Yen has been experiencing a downward move, making it easier for the pair to maintain further downward moves in its recent low.
The AUDJPY shows a bearish flag as the bears dropped the Yen price to the $94.16 support value below the EMA-50 to resume the daily chart today, indicating a high buying impact from the bears, resulting in an opportunity to sell for the short traders.
Based on the outlook, should the bears increase their interest and go lower below the $90.00 high mark, a bearish breakdown confirmation at the $88.00 level will show a bearish flag, reflecting the bearish correction sentiment.
Similarly, the underlying sentiment shows a bearish flag and downtrend continuation in the coming days, as indicated by the daily stochastic pointing down. It is expected of sellers to drop the price of AUDJPY further up to a significant level at a lower level, and in this case, the target might be the $88.00 lower support level soon, as it shows a bearish flag in the higher time frame.
AUDJPY Medium-term Trend: Bearish (4H Chart)
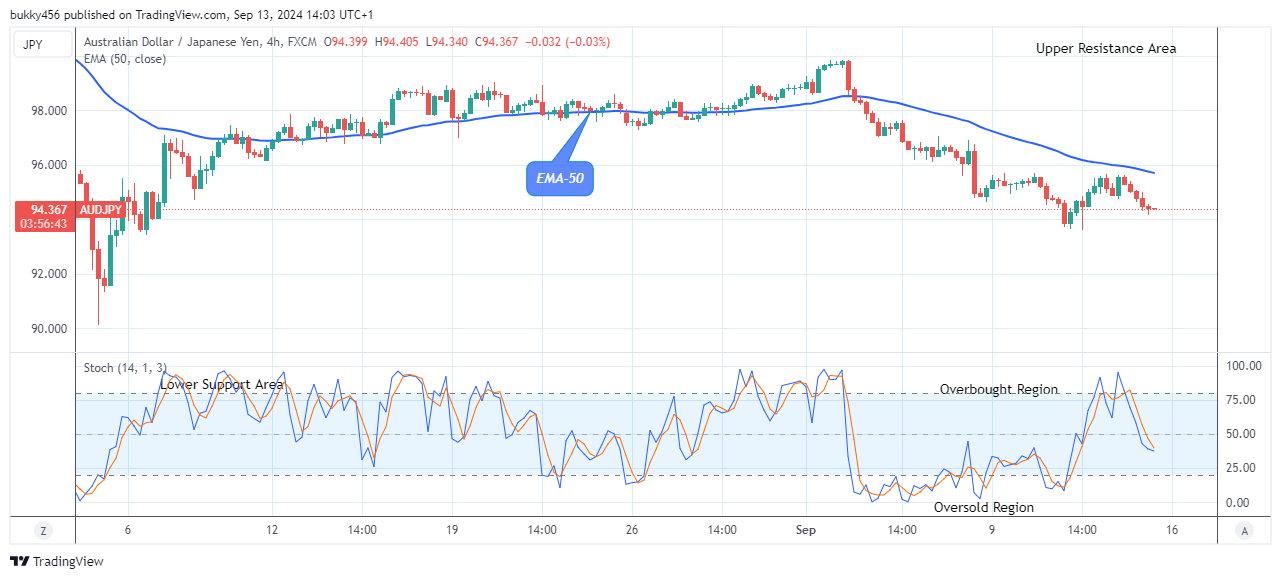
In the medium-term time frame, prices of AUDJPY are below the moving averages and show a bearish flag, suggesting a sell signal. The pair is in a smooth downtrend, as seen from the chart below.
The sustained bearish pressure dropped the currency pair to the $94.97 supply level during the last session, which made it possible for the AUDJPY pair to remain below the supply level in its recent low.
Today, the AUDJPY shows a bearish flag as the bearish action drops the Yen price to a low of $94.34 support level below the moving average as the 4-hourly chart begins due to a high bearish impact on the currency pair.
Hence, AUDJPY shows a bearish flag as indicated by the daily stochastic, pointing downwards indicating more dips. We expect more drops from the pair as the bears continue dictating market conditions.
The bearish correction may reach the $90.11 previous low and extend further to a lower support level at $88.00 in the days ahead before we see another bullish trend in its medium-term perspective.
Note: Forexschoolonline.com is not a financial advisor. Do your research before investing your funds in any financial asset or presented product or event. We are not responsible for your investing results.


Leave a Reply