Upward pressure still dominates both the higher and medium-term time frames.
It is very likely to continue rising as the prices are above the resistance trend line.
AUDJPY Weekly Price Analysis – October 30
The AUDJPY pair is on the verge of more upsides. If the bulls’ momentum should break up the $98.388 resistance mark, the Yen price may further rise to a $100.000 high value and this may invalidate any bearish signs.
AUDJPY Market
Key Levels:
Resistance levels: $95.400, $95.500, $95.600
Support levels: $92.900, $92.800, $92.700
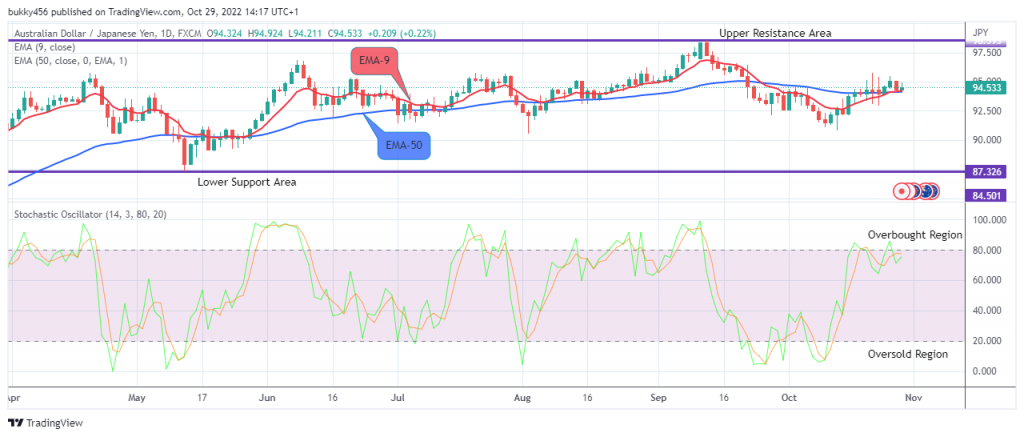
AUDJPY Long-term Trend: Bullish On the daily chart, the AUDJPY pair is trading above the moving averages, which means that it’s in a bullish trend zone. The bears’ pressure on the currency pair at the $94.229 support value further led to a decrease in the price of the Yen during yesterday’s session, after which the momentum was lost.
Today’s daily opening candle at $94.324 above the two EMAs is bullish as the bulls remain dominant in the market.
The buy investors further increase the currency pair up to a $94.924 high mark above the supply trend line and sustain it. This will provide a higher float for buyers and prolong the ongoing recovery.
More so, it is very likely for the AUDJPY price to rise further as the daily stochastic signal is now pointing upwards, we can then expect the bulls to push the price up to the $100.000 supply value in the nearby days in its long-term scenario.
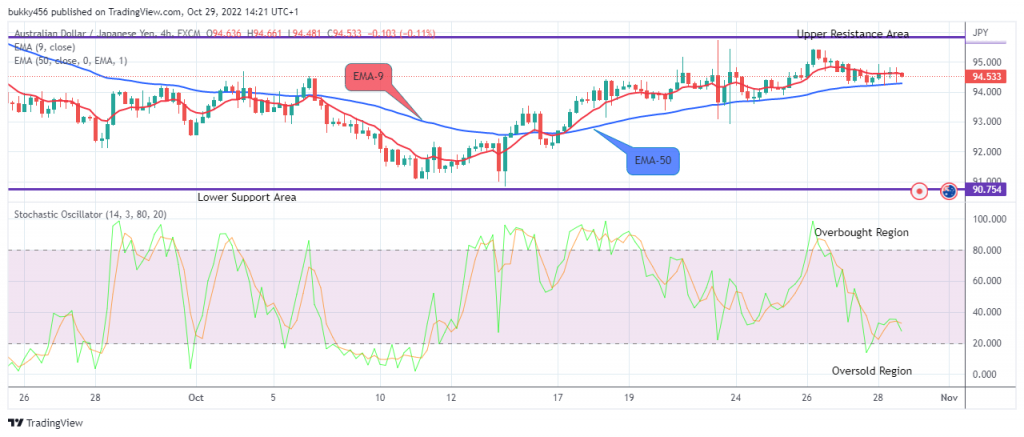
AUDJPY Medium-term Trend: Bullish On the 4-hourly chart, the AUDJPY remains in a bullish trend zone. The Yen’s price is now trading above the EMA-50 despite the moves from sellers.
Today’s 4-hourly chart opens on a bullish note at a $94.924 high value, the bulls lost momentum while the bears drove the pair down to a low at $94.481 level above the EMA-50, but slightly below the EMA-9. This suggests that the momentum in the price of AUDJPY is in an uptrend and with this current trend, buyers remain in control of the price at the present.
Next, the signal from the stochastic oscillator pointing down in the oversold region is an indication that the selling pressure will end soon. This will draw buyers to reverse the trend and in this case, the bullish correction may hit the $100.000 high mark in the nearby days in the medium term.
Note: Forexschoolonline.com is not a financial advisor. Do your research before investing your funds in any financial asset or presented product or event. We are not responsible for your investing results.


Leave a Reply