AUDJPY looking nice, price trades above the resistance zone.
Staying above EMA 50 can lead to strong growth for the currency pair.
AUDJPY Weekly Price Analysis – May 30
AUDJPY price now trades at the top part of the resistance at level $85.152
AUDJPY Market
Key Levels:
Resistance levels: $85.150, $85.160 $85.170
Support levels: $76.250, $76.240, $76.230
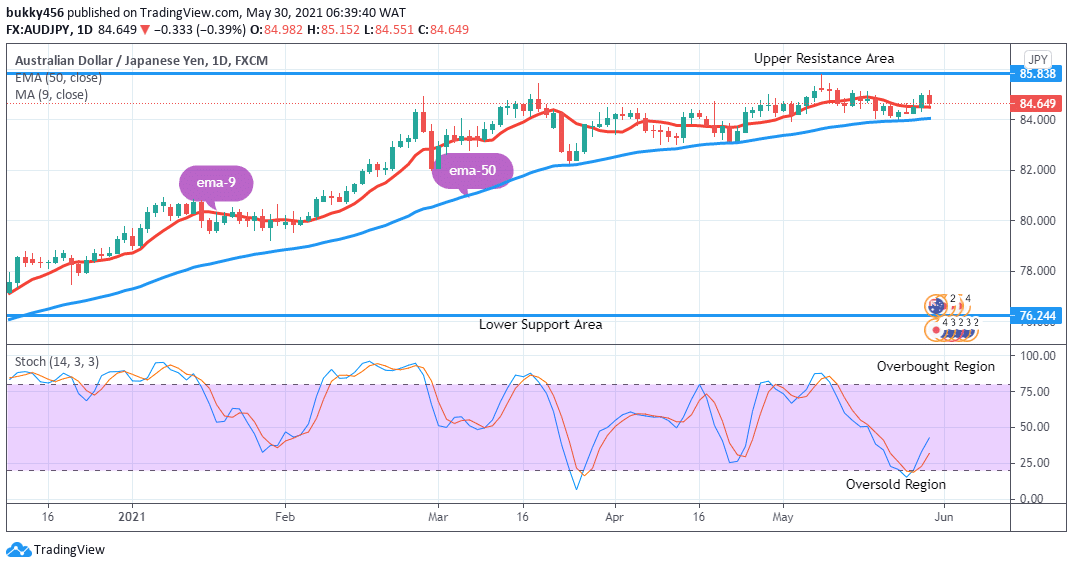
AUDJPY Long-term Trend: Bullish AUDJPY is trading in a bullish trend zone in its long-term outlook. The sustained bullish pressure pushes the currency pair further up at $85.067 in the resistance area during yesterday’s session.
The bears return gradually with an initial drop to $84.982 in the support area as the daily chart opens today.
The currency pair drops further to $84.551 in the support area, now trades above the two EMAs and the stochastic oscillator signal is pointing up at around level 42% in the oversold region, this implies the bulls may continue to dictate the market direction in the long-term.
Hence, buyers may take a position as desired.
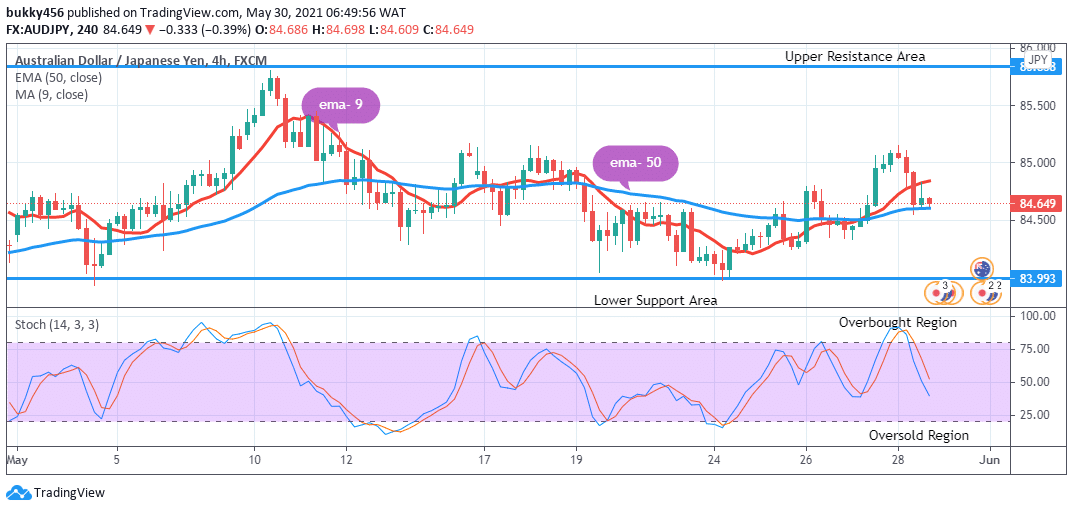
AUDJPY Medium-term Trend: Bullish AUDJPY is in an upward trend in the medium-term perspective. The 4-hourly chart opens with the formation of an inverted bearish pin bar hammer at $85.079 in the support area, an indication of a trend reversal.
Bulls return briefly and move the price up to $84.828 in the resistance area.
The price of AUDJPY is initially down at $84.609 in the support area above the two EMAs, this suggests an upward movement in the price of the currency pair.
However, the stochastic signal pointing down at around level 40% in the oversold area indicates that the price of AUDJPY may likely continue in a downward move in the nearby days, in the medium-term perspective.
Note: Forexschoolonline.com is not a financial advisor. Do your research before
investing your funds in any financial asset or presented product or event. We
are not responsible for your investing results.


Leave a Reply