The upward move still dominates the long-term outlook while the medium-term range is facing a downward move.
The pair is slightly going in favor of the bears.
AUDJPY Weekly Price Analysis – May 23
AUDJPY price staying below EMA-9 at the support level of $84.109, may lead to strong downsides.
AUDJPY Market
Key Levels:
Resistance levels: $85.800, $85.825 $85.850
Support levels: $76.300, $76.275, $76.250
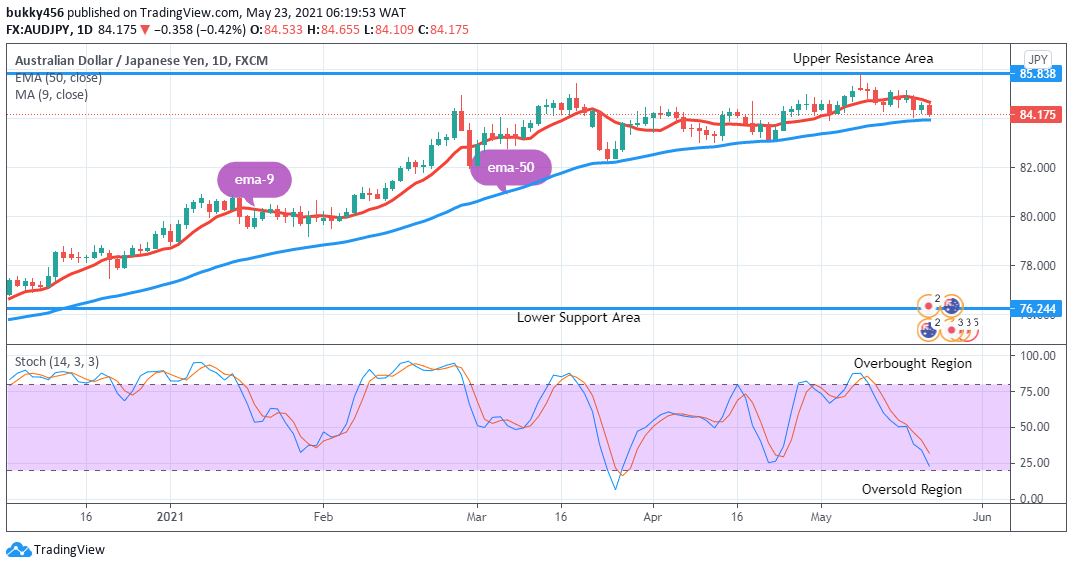
AUDJPY Long-term Trend: Bullish The currency pair is bullish on the daily chart. The impulsive move by the bulls at $84.656 in the resistance area during yesterday’s session is resisted today as the bears resume to the market.
The daily chart today opens at $84.533 in the support area as the bears return briefly to the market.
The momentum in price drops down to $84.109 in the support area as it journeys down south.
AUDJPY now trades below the EMA-9 in the support area; an indication that the bears are in the dominance of the currency pair.
With the daily stochastic oscillator signal pointing downwards at around level 22% in the oversold region, implies that the pair is likely to further depreciate on the downside.
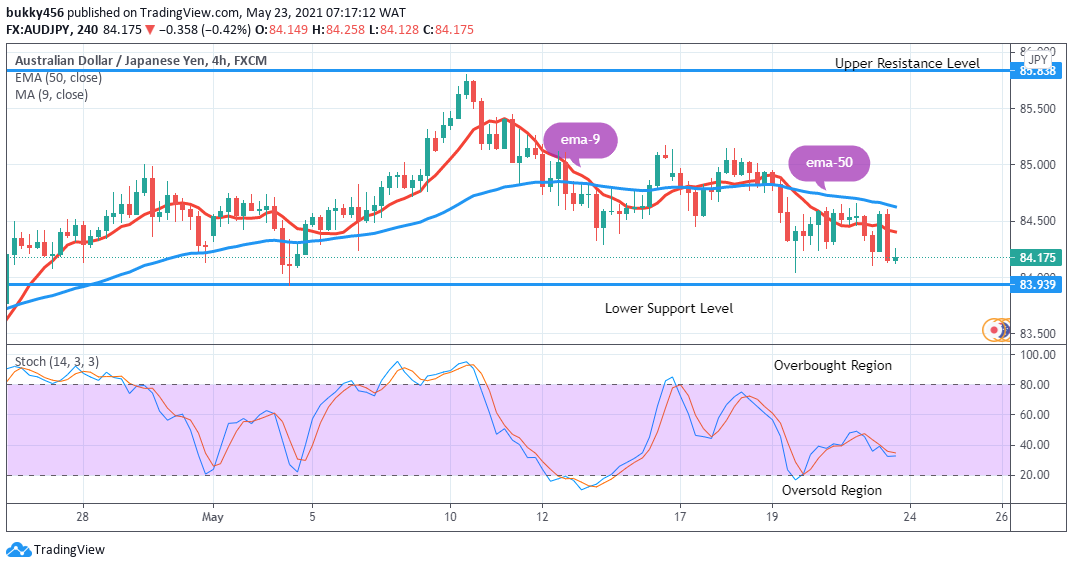
AUDJPY Medium-term Trend: Bearish On the 4-hour chart, the pair is in a downtrend. The pair faces rejection at level 84.134 as the pair resumes a downward move.
The currency price broke the 9-day and 50-day EMAs. AUDJPY is in a bearish trend zone.
Price is currently at $84.258 in the resistance area below the two EMAs, an indication that the bears are in control of the market at the moment.
However, the daily stochastic pointing upwards at around level 33% in the oversold region is an indication of a trend reversal in the nearby days, and in this case an uptrend.
Note: Forexschoolonline.com is not a financial advisor. Do your research before
investing your funds in any financial asset or presented product or event. We
are not responsible for your investing results.
Learn to Trade Forex Online
AUDJPY – Price At The Verge Of Downsides
Footer

ForexSchoolOnline.com helps individual traders learn how to trade the Forex market
WARNING: The content on this site should not be considered investment advice and we are not authorised to provide investment advice. Nothing on this website is an endorsement or recommendation of a particular trading strategy or investment decision. The information on this website is general in nature so you must consider the information in light of your objectives, financial situation and needs.
Investing is speculative. When investing your capital is at risk. This site is not intended for use in jurisdictions in which the trading or investments described are prohibited and should only be used by such persons and in such ways as are legally permitted. Your investment may not qualify for investor protection in your country or state of residence, so please conduct your own due diligence or obtain advice where necessary. This website is free for you to use but we may receive a commission from the companies we feature on this site.
We Introduce people to the world of currency trading. and provide educational content to help them learn how to become profitable traders. we're also a community of traders that support each other on our daily trading journey
Forexschoolonline.com is not a financial advisor. Do your research before investing your funds in any financial asset or presented product or event. We are not responsible for your investing results.

Leave a Reply