The currency pair is going in favor of the bears now.
The bulls may have temporal control.
AUDJPY Weekly Price Analysis – July 24
The sellers may continue the journey downside if the current resistance level at $95.600 holds. The pair may likely depreciate to a low at the $87.302 price level and beyond.
AUDJPY Market
Key Levels:
Resistance levels: $95.500, $95.600 $95.700
Support levels: $87.300, $87.200, $87.100
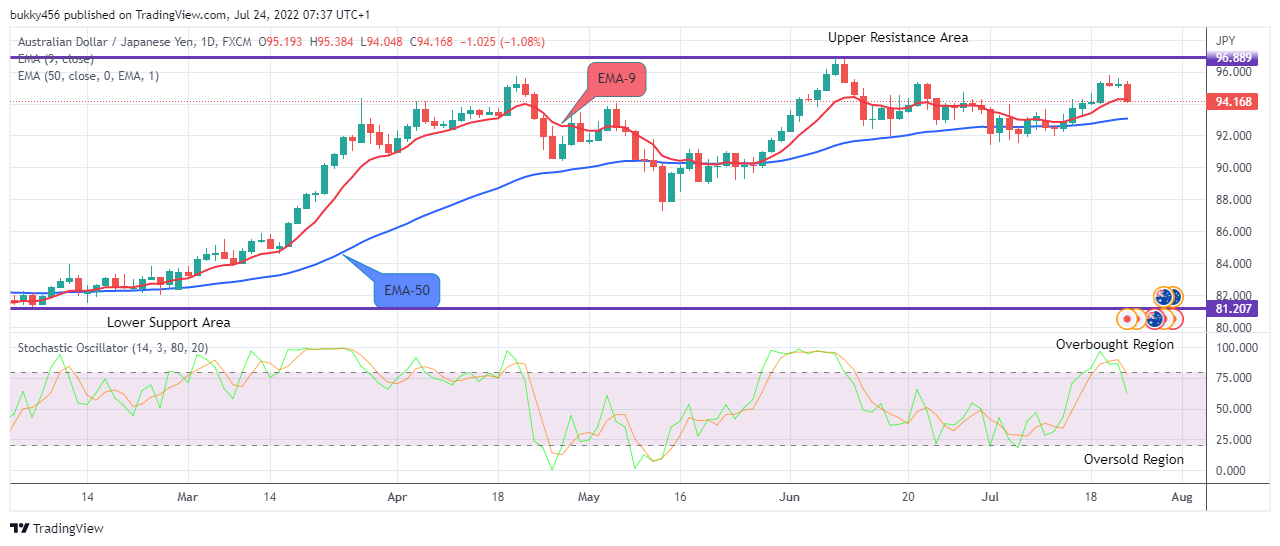
AUDJPY Long-term Trend: Bullish From the chart above we can see that the AUDJPY is in a bullish market in its long-term outlook. Activities from the buyers increased the trend of the currency pair up to a $95.600 high level during yesterday’s session and sustained it.
The bulls lost the momentum and the seller’s in-road and dropped the price of the currency pair down to the $95.193 support level as the daily chart opens today.
The impulse move by the bears further drops the price of AUDJPY down to a $94.168 low level which is above the two moving averages, an indication that the momentum is in an uptrend in the context of the strength of the market.
However, divergence is noticed as the price of AUDJPY is in the overbought region of the daily stochastic pointing down at around level 73% in the overbought region. This indicates that the currency pair might possibly experience a trend reversal, and in this case a downtrend and a sell signal soon in its long-term view.
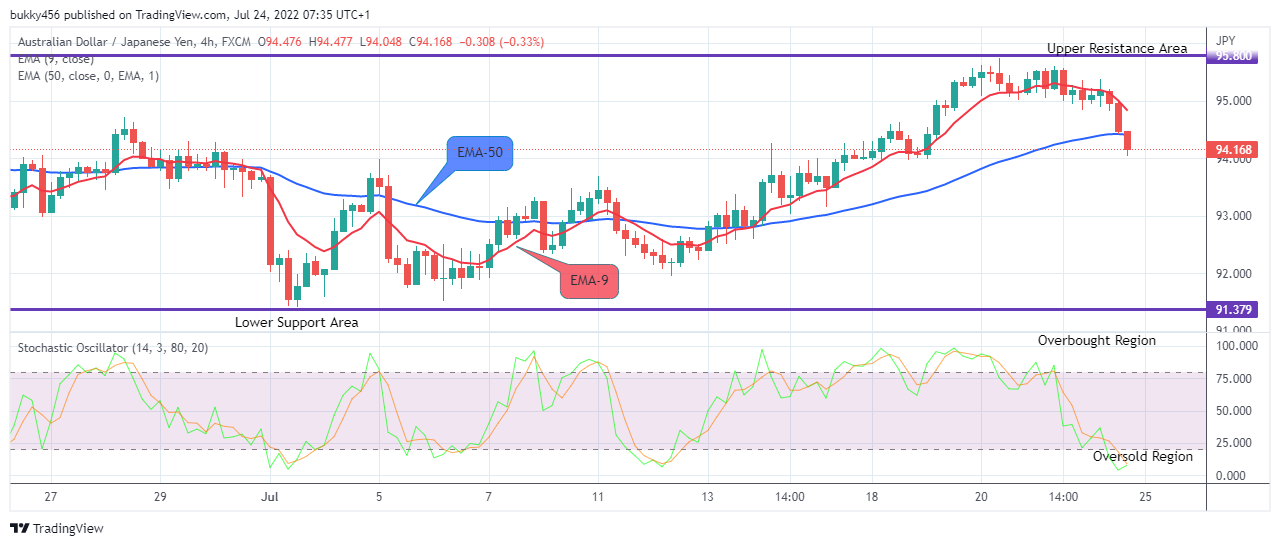
AUDJPY Medium-term Trend: Bearish The momentum on the medium-term time frame is distinctly bearish. It seems the bears are taking over and pushing the price downside.
Today’s 4-hourly chart opens with a bullish pin bar candle at the $95.042 resistance level.
The bears returns briefly and dropped the market value of AUDJPY down to $94.421.
Increased momentum from the sellers further slumped the price down the $94.048 low level below the two moving averages which is an indication of a downward trend.
The stochastic oscillator signals pointing downwards in the oversold region are an indication that the momentum in the price of the currency pair might likely remain in the same direction at the moment in the medium-term.
Hence a sell signal.
Note: Forexschoolonline.com is not a financial advisor. Do your research before investing your funds in any financial asset or presented product or event. We are not responsible for your investing results.


Leave a Reply