The currency pair remains in an upside move.
The bulls are still dominating the market at the moment.
AUDJPY Weekly Price Analysis – February 11
At the moment the AUDJPY market is trading in an uptrend. Meanwhile, the Yen might resume its low-dip moves soon as the market is overbought already. Should the bears prove stronger and the Yen price drop and sustain below the $92.79 previous support level, the price drop could drop down to hit the $90.00 lower support level and beyond, resulting in a good sell forex signal to the short traders.
AUDJPY Market
Key Levels:
Resistance levels: $95.00, $96.00, $97.00
Support levels: $93.00, $92.00, $91.00
AUDJPY Long-term Trend: Bullish (Daily chart)
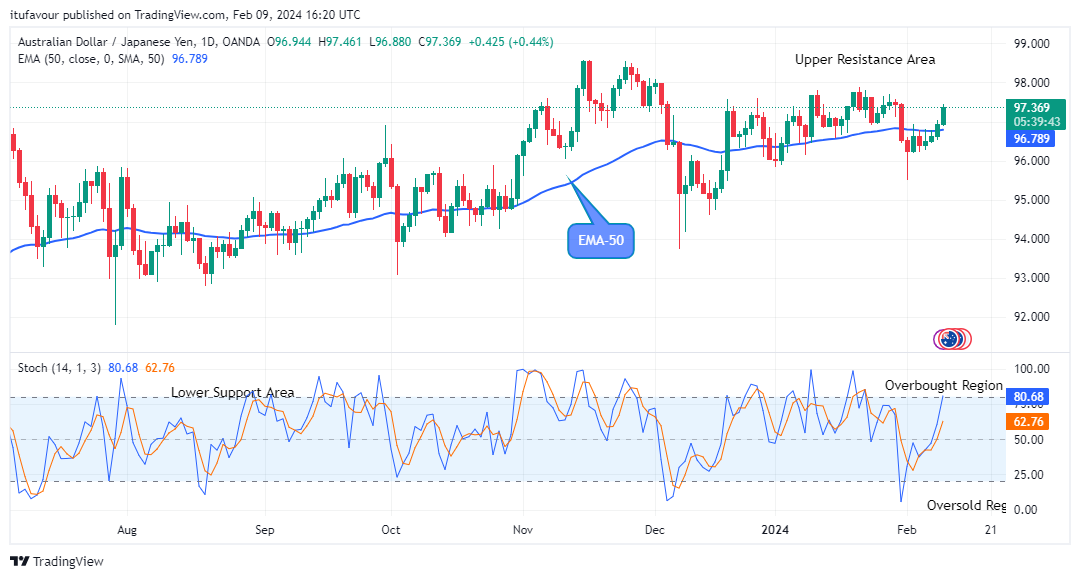
The AUDJPY pair can resume its low-dip moves as the market seems to be overbought at the moment in its long-term outlook. The price of AUDJPY is currently trading at the resistance above the moving averages. So the Yen is still in an uptrend.
The high order flow from the bulls at the $97.04 high value during yesterday’s session also added to this bullishness in its recent high.
The Yen price finds resistance at the $97.46 value above the EMA-50 as the daily session opens today. This suggests an uptrend in the context of the strength of the market. Meanwhile, the market is overbought, so the currency pair can resume its low-dip move soon.
In addition, should AUDPY sellers increase their selling actions and the Yen price dropped from the $97.46 supply and slide down below the $93.06 support mark, the bullish thesis would get invalidated and the Yen price could drop down to a $90.00 lower support trend level in the days to come in its long-term outlook.
AUDJPY Medium-term Trend: Bullish (4H chart)
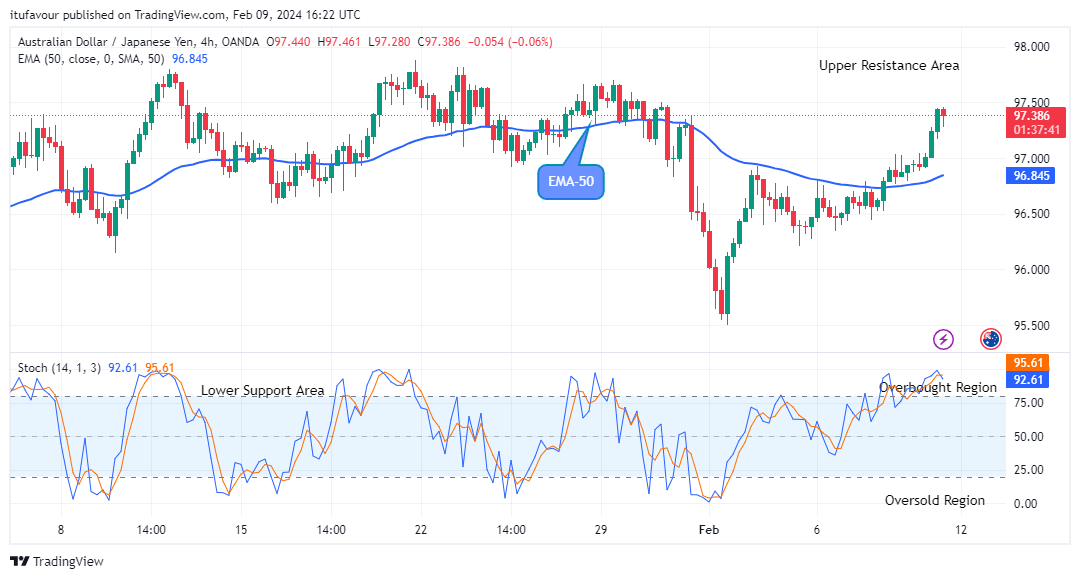
The currency pair is in a bullish market zone in its medium-term outlook. Although, the bears are now involved in the order flow, so the AUDJPY price might resume its low-dip moves soon.
The sustained bullish pressure on the pair at the $97.00 high value during the previous action has made it possible for the AUDJPY price to stay above the supply trend line in its recent high.
After completing the uptick moves, the bears returned briefly and made a downward move to the $97.28 low level above the moving average line to resume its low-dips move as the 4-hourly chart opens today. This bearish continuation pattern occurs in an uptrend and indicates a potential trend reversal.
In addition, we can expect the emergence of more sell investors as the buying pressure is exhausted already, as indicated by the daily stochastic which is pointing down at the overbought region. Thus, the next low-dip moves may reach the $90.00 lower support mark as we watch the bears take over the market conditions sooner in its medium-term perspective.
Note: Forexschoolonline.com is not a financial advisor. Do your research before investing your funds in any financial asset or presented product or event. We are not responsible for your investing results.


Leave a Reply