The AUDJPY downward trend may continue, and a breakdown is imminent.
The bears will dominate soon.
AUDJPY Weekly Price Analysis – August 25
The AUDJPY structure today, suggests that the downward trend may continue and a breakdown is imminent as the buying pressure seems to be exhausted on the daily time frame. The Yen price could continue to slide if it breaks down the $90.11 support level and closes a daily candle. The $88.59 lower support mark might be the target, resulting in a sell opportunity for the short traders
AUDJPY Market
Key Levels:
Resistance levels: $98.00, $99.00, $100.00
Support levels: $90.00, $89.00, $88.00
AUDJPY Long-term Trend: Bearish (Daily chart)
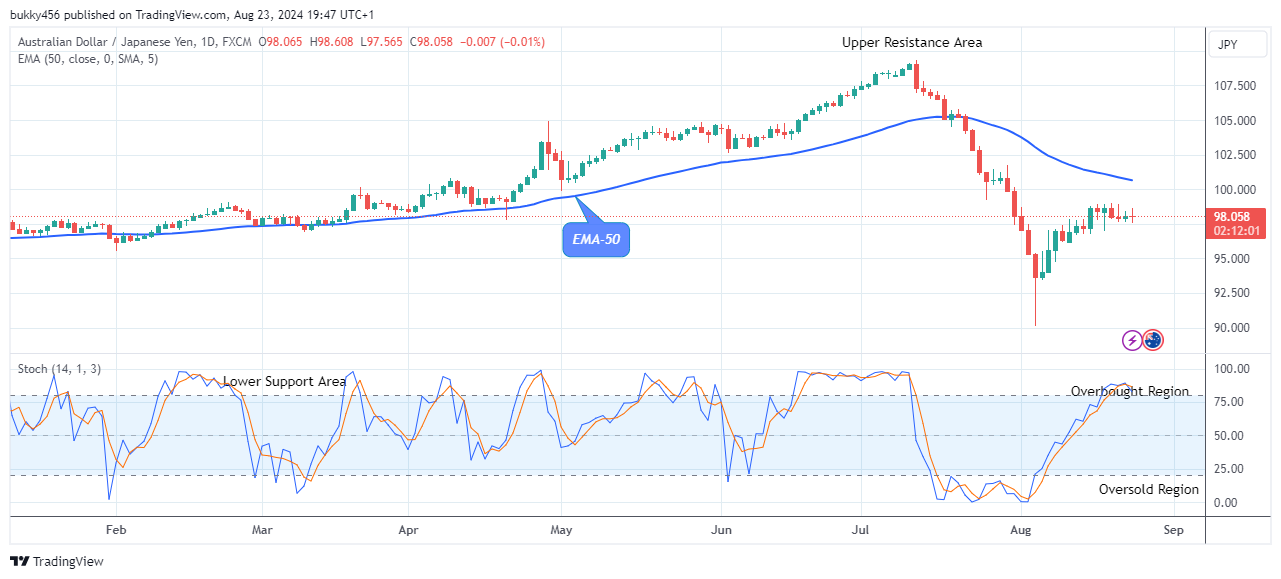
The daily chart market of AUDJPY shows that the downward trend may continue, and a breakdown is imminent as the bears are about to resume the bearish pressure. 
Price is trading below the support of the price channel, suggesting a possibility of a further drop in the Yen’s price. This confirms the presence of more bears’ impact on the currency pair.
The persistent bearish pressure to a $97.63 low mark in the last few days has dropped the AUDJPY price below the supply levels and slowed the bullish run in its recent low.
The market value of AUDJPY drops to a low of $97.56 below the moving average as the daily chart opens today, suggesting a bearish trend.
A possible breakdown from the mentioned supply level will provide a higher footing for sellers and prolong the ongoing correction to reach the $90.11 previous support level.
Hence, the downward trend may continue as indicated by the momentum indicator, pointing downwards at the overbought region. Thus, the price of AUDJPY might remain in a downside movement, and a $88.59 lower support level might be the target in the days ahead in its higher time frame.
AUDJPY Medium-term Trend: Bullish (4H Chart)
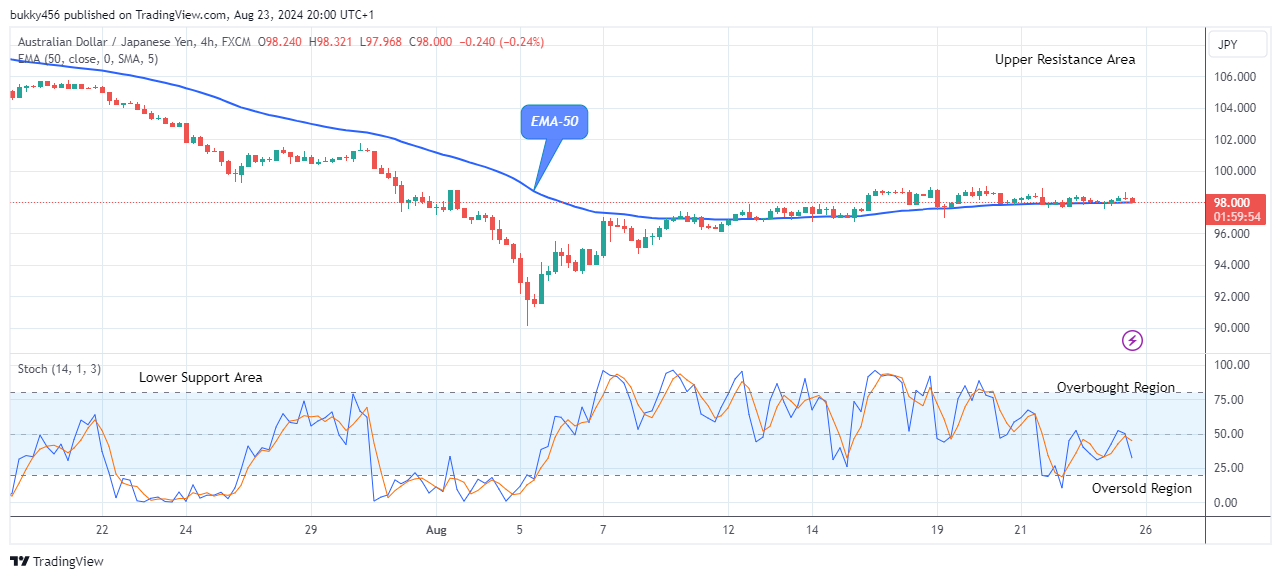
AUDJPY has just begun its downward trends and this may continue as the buying pressure remains held in its medium-term outlook. The price bars can be sighted in red above the supply trend levels. 
The bullish pressure to a $97.91 supply level in the past few days has sustained its price above the high levels in its recent low. The momentum appears bullish; meanwhile, the downward trend has just begun and this may continue as shown by the chart.
The AUDJPY journey down south commences as the bears caused a drop in the Yen price to the $97.96 resistance value above the moving averages as the 4-hourly chart opens today, indicating the starting of the downwards trends and more active sell traders in the price flow.
Further, an increase in the selling pressure might lead the AUDJPY price to retest the previous low of the $90.11 mark, obtaining a higher footing to drop lower.
However, the daily stochastic pointing in a downward direction, suggests the downward trend may continue and a breakdown is imminent.
Therefore, if the sellers should intensify their tension in the market and the prices break down the $90.11 resistance trend line, a downward trend continuation to the lower support of $88.59 is possible soon in the medium-term perspective.
Note: Forexschoolonline.com is not a financial advisor. Do your research before investing your funds in any financial asset or presented product or event. We are not responsible for your investing results.


Leave a Reply