A bullish scenario is playing out in the long term.
The bears may have temporal control.
AUDJPY Weekly Price Analysis – August 13
Staying above the EMA-9 can lead to strong growth for AUDJPY.
AUDJPY Market
Key Levels:
Resistance levels: $82.000, $82.005 $82.010
Support levels: $80.230, $80.225, $80.220
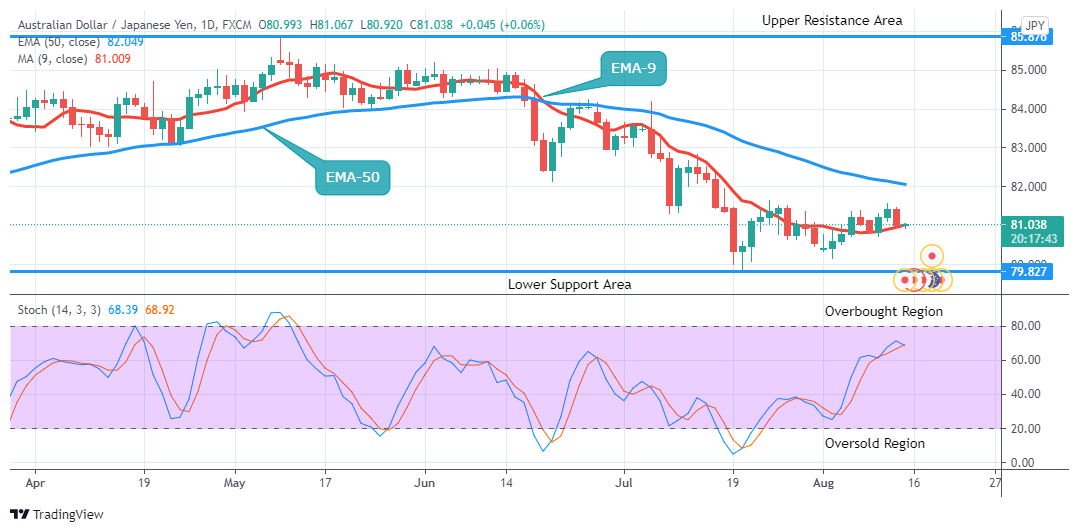
AUDJPY Long-term trend: Bullish On the daily chart, the momentum is in an upward move. The bears increased momentum dropped the price down to $80.949 in the support area, during yesterday’s session. The momentum was lost as exhaustion sets in as the bulls return briefly.
Today’s daily pin bar opening candle at $80.993 is bullish as the bulls return briefly to the market.
AUDJPY rises further to $81.067 in the resistance area. Price is above the EMA-9, an indication of an uptrend in the context of the strength.
The signal of the stochastic oscillator pointing down at around level 68% in the overbought region suggests a downward momentum in the price of the Yen also the currency pair may likely encounter a change in trend in the days ahead in the long-term perspective.
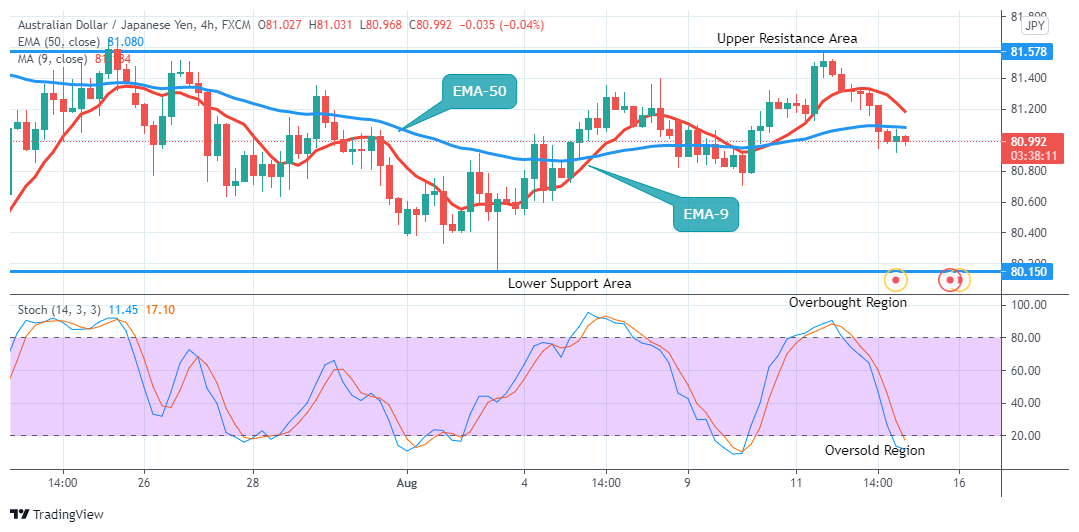
AUDJPY Medium-term trend: Bearish The currency pair is in a bearish trend market zone in its medium-term outlook. $81.067 in the resistance area was the high attained during yesterday’s session.
The 4-hourly chart today opens with a bearish candle at $81.027 in the support area.
Price is initially down at $80.968 in the support area below the two EMAs, this implies the momentum in price is in a downwards trend in the context of the strength of the market.
The stochastic oscillator signal pointing down at around level 14% in the oversold region suggests the momentum in price is in a downtrend and may likely continue in the same direction in the days ahead in the medium-term.
Note: Forexschoolonline.com is not a financial advisor. Do your research before investing your funds in any financial asset or presented product or event. We are not responsible for your investing results.
Learn to Trade Forex Online
AUDJPY : Could Still Increase Despite a Minor Decline
Footer

ForexSchoolOnline.com helps individual traders learn how to trade the Forex market
WARNING: The content on this site should not be considered investment advice and we are not authorised to provide investment advice. Nothing on this website is an endorsement or recommendation of a particular trading strategy or investment decision. The information on this website is general in nature so you must consider the information in light of your objectives, financial situation and needs.
Investing is speculative. When investing your capital is at risk. This site is not intended for use in jurisdictions in which the trading or investments described are prohibited and should only be used by such persons and in such ways as are legally permitted. Your investment may not qualify for investor protection in your country or state of residence, so please conduct your own due diligence or obtain advice where necessary. This website is free for you to use but we may receive a commission from the companies we feature on this site.
We Introduce people to the world of currency trading. and provide educational content to help them learn how to become profitable traders. we're also a community of traders that support each other on our daily trading journey
Forexschoolonline.com is not a financial advisor. Do your research before investing your funds in any financial asset or presented product or event. We are not responsible for your investing results.

Leave a Reply