The currency pair is going in favor of the bears now.
Overall market sentiment regarding the pair remains bearish.
AUDJPY Weekly Price Analysis – June 13
If the support level is broken the market will depreciate to a low at $79.115 price level.
AUDJPY Market
Key Levels:
Resistance levels: $85.840, $85.845 $85.850
Support levels: $79.125, $79.120, $79.115
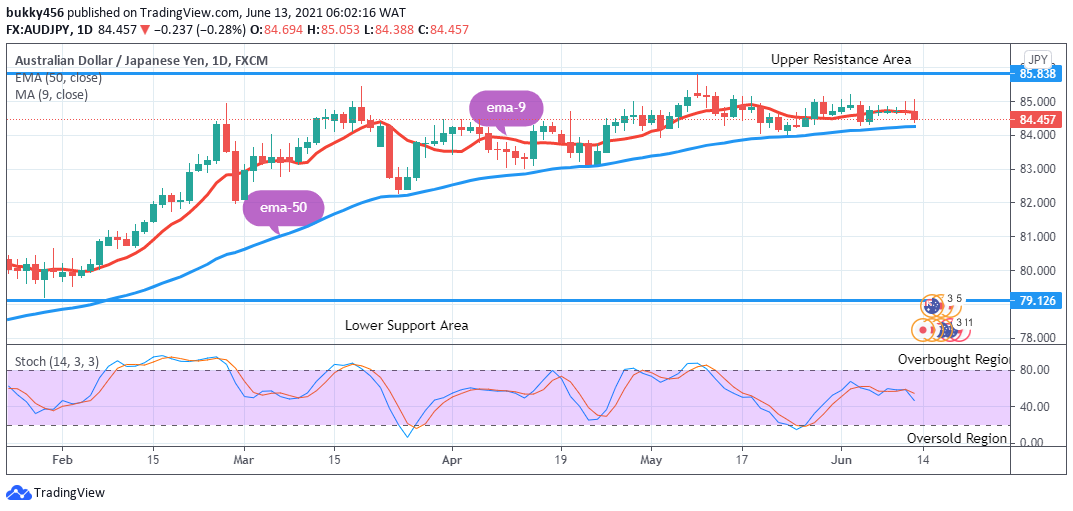
AUDJPY Long-term Trend: Bullish Analyzing the chart above, we can see that the AUDJPY is in a bullish market in its long-term outlook. Activities from the sellers dropped the trend of the currency pair down to $84.626 in the support area before the close of yesterday’s session.
The momentum from the sellers continues as the daily chart opens today at $84.694 in the support area.
The impulse move by the bears further drops the price of AUDJPY down to $84.457 in the support area.
The price of AUDJPY is initially down at $84.388 in the support area above the EMA-50 an indication that the momentum is in an uptrend in the context of the strength of the market.
Meanwhile, the price of AUDJPY is in the overbought region of the daily stochastic pointing down at around level 48% in the oversold region. This indicates that the currency pair might possibly experience a trend reversal and in this case a downtrend and a sell signal.
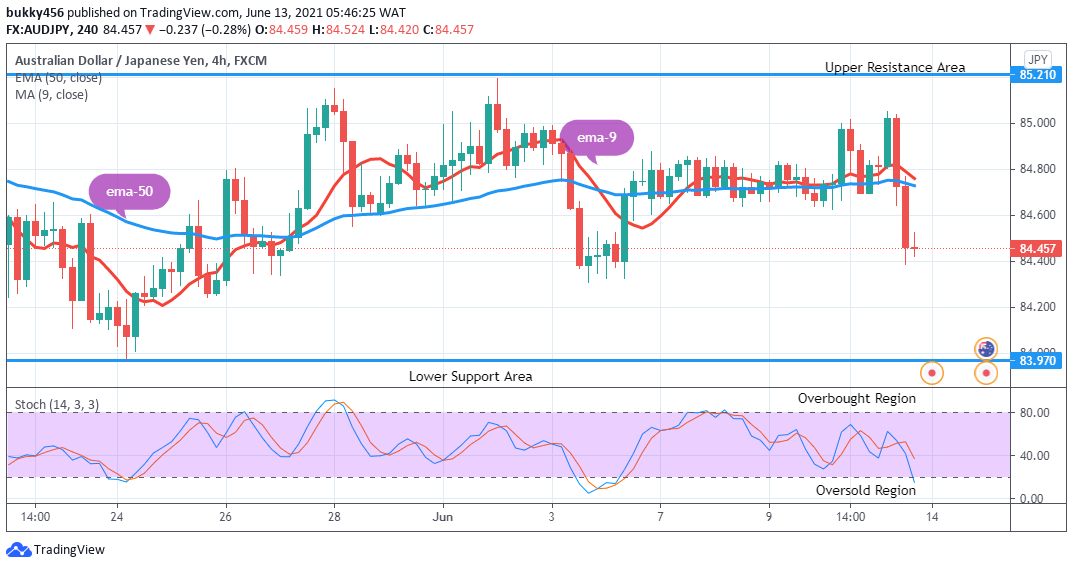
AUDJPY Medium-term Trend: Bearish AUDJPY is in a bearish trend in its medium-term outlook. The bulls managed to push the price of the Yen up at $84.838 in the resistance area shortly after yesterday’s opening before the momentum loss. AUDJPY afterward dropped down to $84.694 in the support area before the end of yesterday’s session.
Today’s 4-hour chart opens with a bearish doji candle at $83.815 in the support area.
The breakdown in price at the EMAs crossover with a large bearish candle at $84.644 in the support area confirms the bears’ takeover as the journey down south continues.
Pressure from the sellers further drops the price of AUDJPY down to $84.388 in the support area below the two EMAs, this suggests that the momentum in the price of the Yen is in a downtrend. Hence a sell signal.
The stochastic oscillator signals pointing downwards at around level 18% in the oversold region is an indication that the momentum in the price of the currency pair might likely remain in the same direction in the days ahead in the medium-term. Hence a sell signal.
Note: Forexschoolonline.com is not a financial advisor. Do your research before investing your funds in any financial asset or presented product or event. We are not responsible for your investing results.
Learn to Trade Forex Online
AUDJPY – Are The Bulls Going To Show Up? (Again)
Footer

ForexSchoolOnline.com helps individual traders learn how to trade the Forex market
WARNING: The content on this site should not be considered investment advice and we are not authorised to provide investment advice. Nothing on this website is an endorsement or recommendation of a particular trading strategy or investment decision. The information on this website is general in nature so you must consider the information in light of your objectives, financial situation and needs.
Investing is speculative. When investing your capital is at risk. This site is not intended for use in jurisdictions in which the trading or investments described are prohibited and should only be used by such persons and in such ways as are legally permitted. Your investment may not qualify for investor protection in your country or state of residence, so please conduct your own due diligence or obtain advice where necessary. This website is free for you to use but we may receive a commission from the companies we feature on this site.
We Introduce people to the world of currency trading. and provide educational content to help them learn how to become profitable traders. we're also a community of traders that support each other on our daily trading journey
Forexschoolonline.com is not a financial advisor. Do your research before investing your funds in any financial asset or presented product or event. We are not responsible for your investing results.

Leave a Reply