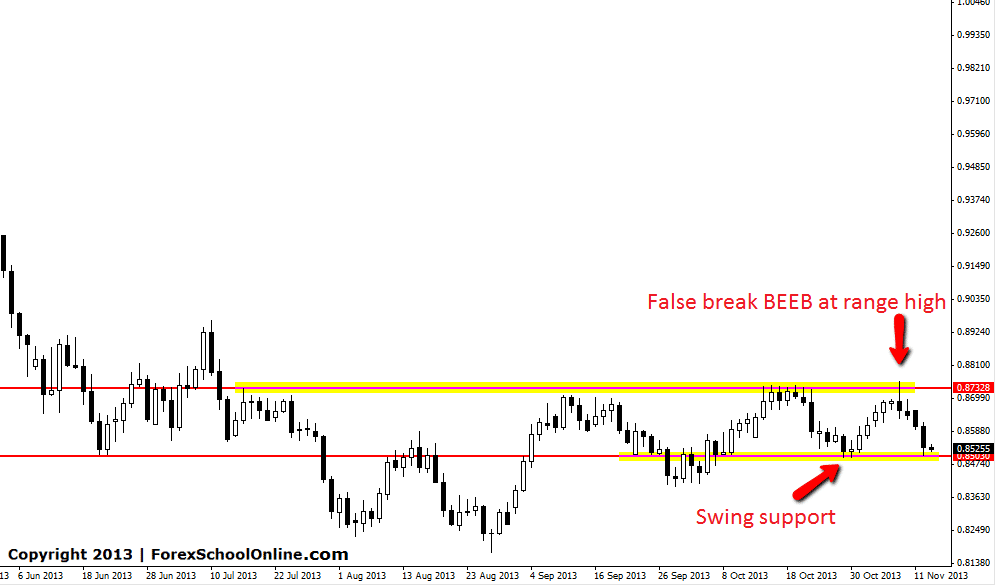
Price on the daily chart of the AUDCHF has moved lower and into the recent lows which has previously acted as a swing support. This move lower was kicked off by a large bearish engulfing bar (BEEB) that formed up at the high and was making a clear false break of the key resistance in this market. This pair has been trading in a range in recent times and the best way to trade ranges is by making trades from the highs and lows of the range. Where traders get caught out is by making trades in the middle of the range. This is where price will often whipsaw and stop traders. By making trades at the high or low of the range the highest probability trades can be made along with best risk reward.
This trade formed on the same day as the NZDCHF formed it’s false break BEEB. Often when one correlated pair fires off a daily price action signal another pair with the same currency will also form a similar price action signal. I posted the NZDCHF false break BEEB in this blog live and you can read about that HERE.
AUDCHF Daily Chart


Leave a Reply