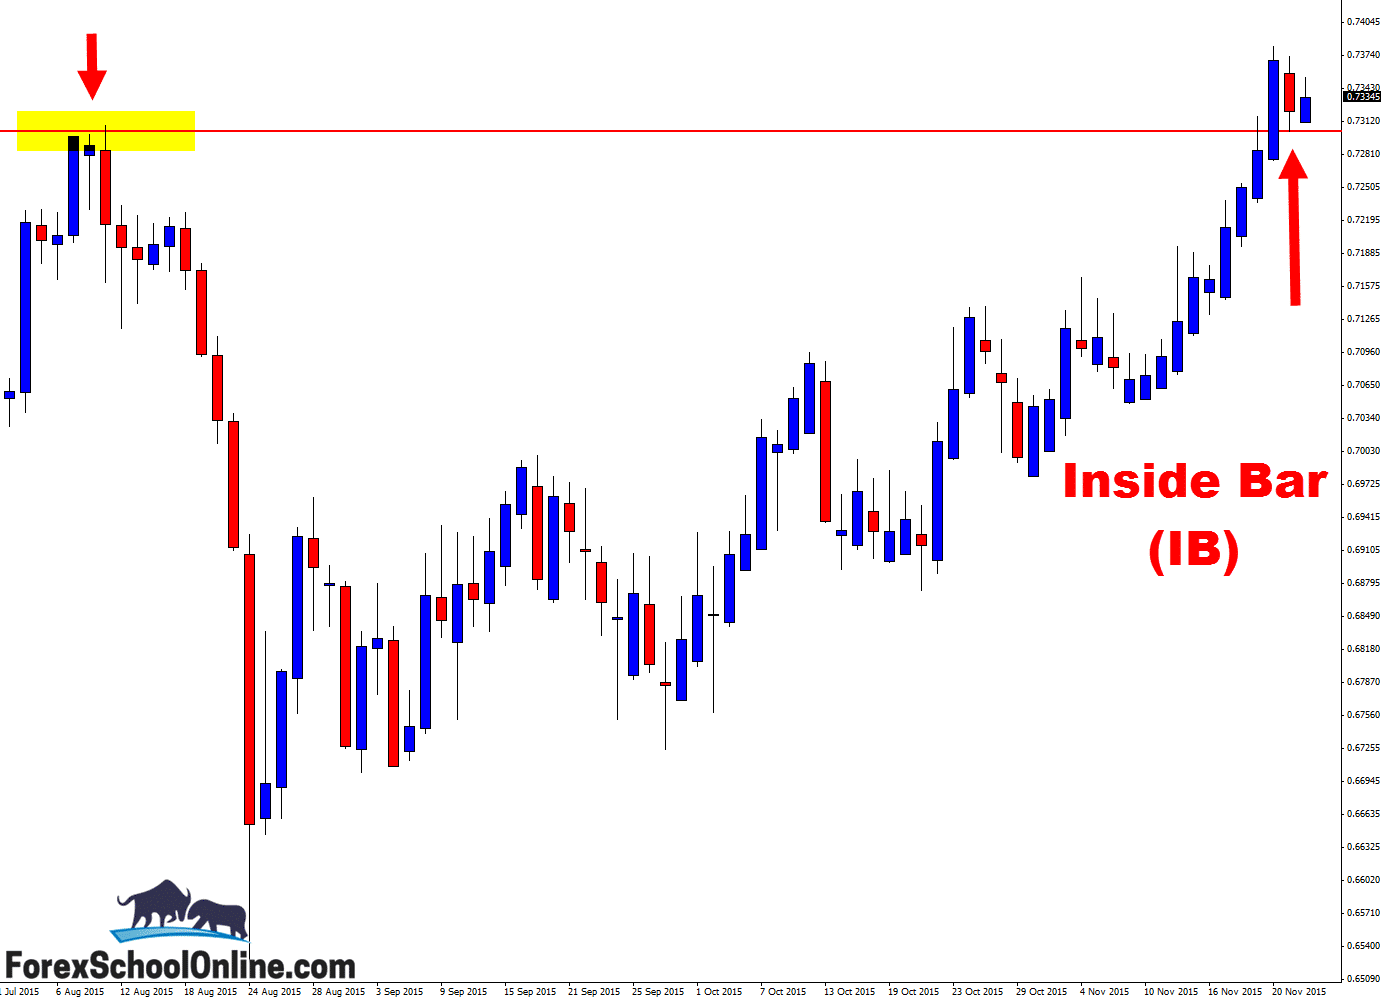
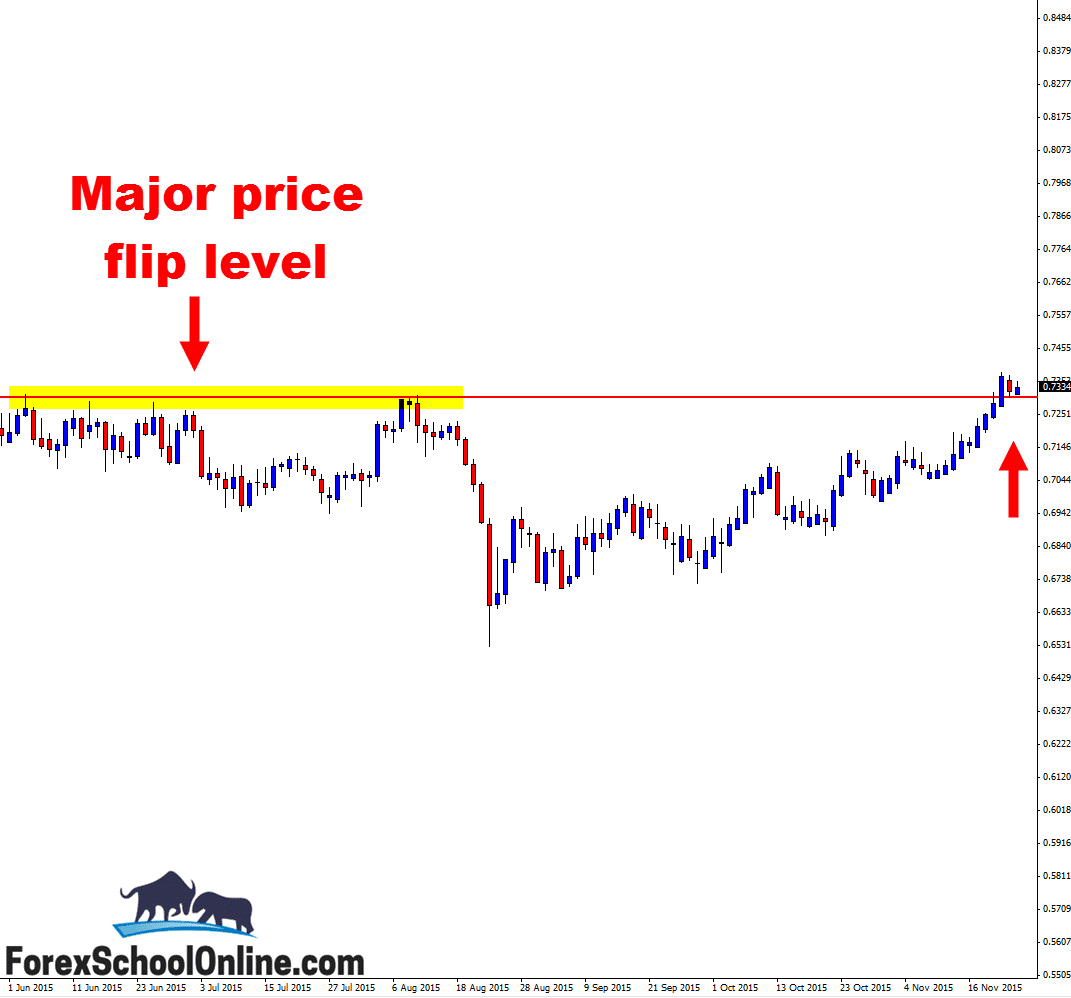
Price on the AUDCHF has fired off an inside bar = IB that is sitting just above a major support level on the daily price action chart. This inside bar is rejecting almost to the pip the daily price flip level. As you can see on both charts below; the low of the inside bar is testing the high of the new support level/old resistance level.
This level is crucial to where price goes in the coming sessions and how price behaves around this level could now decide where it goes over the next week. Previous to forming the inside bar, price had very clearly been making higher highs and higher lows with a clear move higher.
Price did not even pause at the daily resistance. It just smashed on through and broke straight out. It has now however paused and formed the inside bar which is a pausing formation.
Inside Bars are a candlestick that show that price and the market is indecisive. Whereas an engulfing bar is the opposite and is a momentum candle that is very decisive. Inside bars will often be reversals or consolidation setups and whilst these are contradictory, the reason inside bars can do both is because they are indecision candles. It is up to the price action trader to use the price action story around the inside bar, rather than just the inside bar itself to decide what the best play is.
On this occasion, if price can break higher and through the high of the housing candle, then the next resistance comes in around the 0.7415 area and then the 0.7530 level.
If however price breaks lower, a huge watch is on the support price flip level to see if it can hold, and if not, to see if price flips again.
Daily Chart – Inside Bar

Daily Chart – Daily Price Flip Level


Leave a Reply