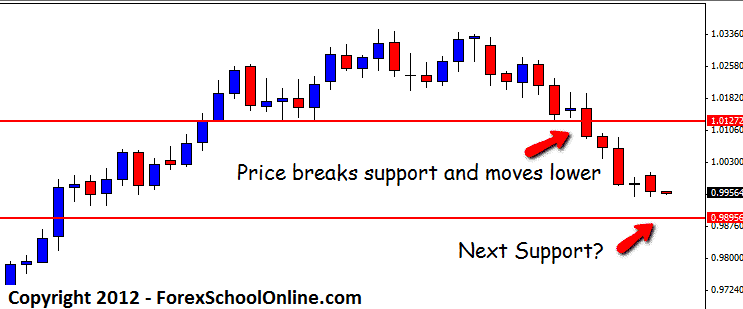
Last week we covered the AUDCHF and how it was beginning to look very weak. To read this post go HERE. Price had a made an Inside Bar on the daily chart that was sitting right on support. Once price broke lower from this Inside Bar, price collapsed lower.
Price is moving closer to the long term support which comes in around 0.9895. This area was a clear resistance level before price broke through higher. We would now expect this old resistance to look to hold as new support should price get there. If price does respect this support, we may see a bounce higher against this recent down move. If price fails to respect this area the next support would come in around 0.9680.
AUDCHF DAILY CHART – AUGUST 28


Leave a Reply